
Introduction
Agriculture contributes significantly in the Indian economy, approximately to the tune of 16% of GDP (Gross Domestic Product) and provides livelihood to 46.1 % of the population.1 Given water’s importance in producing food, rising domestic and industrial demands worldwide have led to concerns about water scarcity. In India, much of farming relies on rainfall, but decreasing rainfall patterns and variations in climate have pushed farmers to depend more on irrigation. The potential demand for irrigation water in India will increase by approximately 17% by the year 2025 as per estimates of International Water Management Institute (IWMI).2
Data from the Central Water Commission (CWC) of India indicates that the country’s rivers provide an annual water availability of 1869 Billion Cubic Meters (BCM). However, due to factors such as uneven distribution and various physical constraints, only approximately 1123 BCM per year is actually usable. This accessible water comprises 690 BCM per year from surface sources and 433 BCM per year from groundwater. The CWC report highlights that groundwater extraction for irrigation is the predominant use of this resource in India, underscoring the agricultural sector’s significant dependence on it.3 Supporting this finding, the Ministry of Agriculture & Farmer’s Welfare has reported a notable rise in the utilization of tube wells for irrigation purposes. This increasing reliance on tube wells exacerbates the pressure on groundwater reserves and intensifies the country’s water scarcity issues.2 Therefore, enhancing the efficiency of irrigation systems is crucial. By adopting strategies that optimize water usage and minimize waste, the agricultural sector can improve its management of water resources and alleviate the burden on groundwater supplies. The implementation and expansion of efficient irrigation practices represent a practical and immediate solution to address India’s agricultural water shortages.
Assam, a state in Northeast India, is characterized by its diverse topography, predominantly hilly terrain, and high annual rainfall averaging 2,500 mm per year. Despite ample water resources, traditional irrigation methods often lead to inefficiencies, making micro-irrigation a viable alternative for sustainable agriculture. The state has a substantial agricultural base with crops such as tea, rice, horticultural produce, and spices, which require efficient water management. Conventional irrigation practices, such as flood irrigation, are not suitable for the undulating landscapes of Assam. They often lead to soil erosion, water wastage, and reduced crop yields Micro-irrigation offers a solution to the pressing water management issues in Assam’s hilly regions.
Studies suggest that micro-irrigation can reduce water usage by 30-50% while increasing crop yields by 20-30%.4-8 This efficiency is particularly crucial for small and marginal farmers, who make up over 80% of the farming population in Assam. The most recent economic survey of Assam indicates a total geographical area of 78.44 lakh hectares, with a gross cropped area of 38.72 lakh hectares. However, the net sown area stands at only 27.49 lakh hectares (as of 2023-24), suggesting ample potential for expanding both seasonal and spatial irrigation coverage.9
Discussions with officials from the Department of Agriculture, research institutes, and field staff confirm that many farmers are reluctant to adopt micro-irrigation technology because of high perceived costs and limited awareness. Despite the higher upfront costs, micro-irrigation can considerably boost farmers’ incomes.10 Although the Government of India has introduced multiple programs since 2006 to promote micro-irrigation11 such as the Pradhan Mantri Krishi Sinchayee Yojana (PMKSY) and the Micro-irrigation Fund—uptake in Assam remains slow. Even with subsidies, few farmers are opting for micro-irrigation systems, highlighting the need for increased awareness and targeted efforts to address cost concerns. Wider adoption in Assam could significantly improve agricultural productivity within the state.
Micro-irrigation has been extensively researched in India, focusing on enhancing water use efficiency, crop productivity, and sustainable agricultural practices. Most existing studies on micro-irrigation primarily focus on crop yield and productivity, often overlooking Assam and centring instead on other regions of India. Hence, this study has been conducted in Assam to examine farmers’ irrigation requirements. The study aims to assess the range of factors that shape irrigation choices and to investigate barriers to adopting different irrigation methods. By concentrating on Assam’s unique context, this research will shed new light on micro-irrigation practices in the state.
Materials and Methods
The present study employs a mixed-method approach, incorporating primary data from farmer surveys, expert interviews, and secondary data from government reports, academic research, and case studies. Data analysis includes qualitative insights and quantitative assessments of agricultural productivity and water savings from micro-irrigation techniques. The research was conducted in two phases – one to gauge the current challenges, issues while using or installing micro-irrigation system and subsequently in second phase to test some of the models of design management to develop a feasible solution.
The research was carried out in two phases during 2021-2023. In first phase of the research, preliminary field study was conducted in the districts of Dhemaji, Dibrugarh, Golaghat, Jorhat, Nagaon, Sivasagar, and Sonitpur. The sample size was 225 farmers who either received or applied for government subsidies under PMKSY government scheme to implement micro-irrigation.12 A structured questionnaire designed in consultation with experts and officials was used to capture responses.
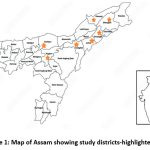 |
Figure 1: Map of Assam showing study districts-highlighted. |
Key information gathered included
Demographics
Age, education level, farming experience, and landholding size.
Farming Details
Non-farm income, crops grown, area under micro-irrigation, years of adoption, and type of micro-irrigation system.
Adoption Insights
Continuity of use, fertigation, subsidy status, water source type and quality, and technical support availability.
Design intervention has many ways for strategic analysis while proposing alternative design solutions whether in terms of system, product or service. During the phase 1 of the study, the MSDS (Modular System Design for Sustainability)13 was referred. This method allows one to understand the entire system as a whole and is very suitable for public institutions to design a sustainable system. It is a modular approach comprising of four stages which are customisable. The four stages are – strategic analysis; exploring opportunities; designing system concepts; and design of system. As a part of strategic analysis, the preliminary discussions identified the following key barriers to micro-irrigation adoption:
High rainfall in the region
High investment costs
Insufficient government subsidies
Difficulty accessing subsidies
Lack of awareness
Limited water sources or pumps
Maintenance challenges (e.g., clogged drippers).
Farmers were also asked to rank these seven challenges by impact to prioritize solutions effectively. While analysing the responses for ranks, Garett Ranking Method14 was used primarily because in this method the constraints can be arranged in their order of severity or priority based upon the respondents’ feedback. The Garett Ranking converts the corresponding ranks into percent position for which mean value can be calculated using a formula to analyse and understand the result. The Garrett score conversion formula14 is
![]()
where,
Rij – Rank given for the ith variable by the jth respondents
Nij – Number of variables ranked by jth respondents
Respondents ranked the following key constraints to micro-irrigation adoption, which were analyzed using the Garrett technique.
Table 1: Garett Ranking variables
| Sl.No. | Variables for Ranking |
| 1 | Rainfall in abundance |
| 2 | Expensive to install |
| 3 | Less subsidies from Govt. |
| 4 | Challenges in receiving subsidies |
| 5 | Unaware of Micro-irrigation |
| 6 | Water source/pumping unit unavailable |
| 7 | Not easy to maintain – before/after installation |
Table 2: Garett table
| Sl.No. | 100(Rij -0.5)/Nij | Garrett Value |
| 1 | 7.14 | 78 |
| 2 | 21.43 | 66 |
| 3 | 35.71 | 58 |
| 4 | 50.00 | 50 |
| 5 | 64.29 | 43 |
| 6 | 78.57 | 35 |
| 7 | 92.86 | 21 |
A review of research done in the agricultural system design revealed that the design support-oriented methods advocate leveraging farmer’s knowledge and design capabilities helped for developing and transitioning into a new system.15-19 Therefore a farmer was directly involved in the study later during the phase 2 of this study,20 who volunteered for the field work. The study plot is located in the Kamrup District of Assam State. The plot is located at 26018’39.7” N and 91045’07.9” E having an orchard of 200 numbers of Assam lemons & 150 numbers of Orange plants. The farmer had also applied for getting financial subsidy in the PMKSY, however, due to the constraints in disbursal process, he was yet to receive the subsidy even after 6 months.
 |
Figure 2: Google Earth imagery of the project site |
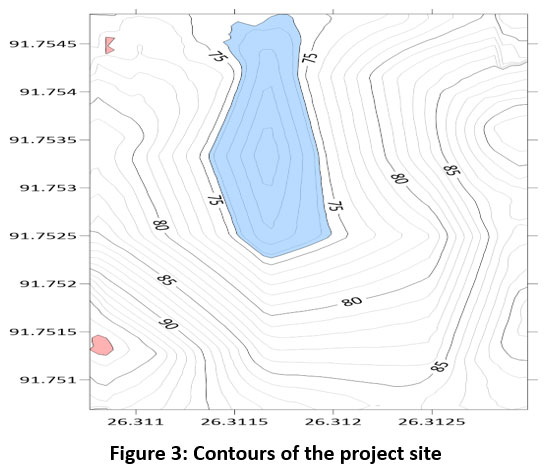 |
Figure 3: Contours of the project site |
The highest elevation point is at 90m and water source is at 75m. There is 1.37 or 137% grade of slope at the site (angle of elevation is 54 degrees). Contour map is presented for a better overview.
Results
The results obtained in this study are presented phase wise to follow the context as presented above.
Phase 1 Results
Field survey results
The descriptive statistics analysis of data collected from 225 farmers highlights key trends. Approximately 56% practice multi-cropping (three crops annually), while 37% cultivate two crops. Most respondents (87%) opted for sprinkler irrigation due to its lower installation cost compared to drip systems. Subsidy coverage includes 55% of costs for small and marginal farmers and 45% for others, based on standardized unit costs. Installation costs range from INR 52,000/ha for sprinklers to INR 113,000–150,000 /ha for drip systems. About 80% of farmers plan to continue using micro-irrigation due to its convenience, and 87% have availed subsidies. While 63% use their own water sources, the same percentage face challenges with iron and other impurities, requiring additional filtration costs. Respondents also ranked the identified seven key constraints to micro-irrigation adoption.
Table 3: Ranking of constraints – feedback from respondents.
| Rank | ||||||||
| Sl.No. | Description | 1st | 2nd | 3rd | 4th | 5th | 6th | 7th |
| 1 | Rainfall in abundance | 90 | 45 | 42 | 38 | 10 | 0 | 0 |
| 2 | Expensive to install | 206 | 19 | 0 | 0 | 0 | 0 | 0 |
| 3 | Less subsidies from Govt. | 61 | 68 | 84 | 13 | 0 | 0 | 0 |
| 4 | Challenges in receiving subsidies | 145 | 74 | 6 | 0 | 0 | 0 | 0 |
| 5 | Unaware of Micro-irrigation | 109 | 84 | 32 | 0 | 0 | 0 | 0 |
| 6 | Water source/pumping unit unavailable | 29 | 35 | 74 | 77 | 10 | 0 | 0 |
| 7 | Not easy to maintain – before/after installation | 10 | 3 | 80 | 41 | 46 | 16 | 29 |
Table 4: Garett Values
| Sl.No. | Description | 1st | 2nd | 3rd | 4th | 5th | 6th | 7th | Total | Garrett Score | Rank |
| 1 | Rainfall in abundance | 7020 | 2970 | 2436 | 1900 | 430 | 0 | 0 | 14756 | 65.58 | 4 |
| 2 | Expensive to install | 16046 | 1273 | 0 | 0 | 0 | 0 | 0 | 17319 | 76.97 | 1 |
| 3 | Less subsidies from Govt. | 4764 | 4455 | 4847 | 643 | 0 | 0 | 0 | 14709 | 65.37 | 5 |
| 4 | Challenges in receiving subsidies | 11282 | 4879 | 373 | 0 | 0 | 0 | 0 | 16534 | 73.49 | 2 |
| 5 | Unaware of Micro-irrigation | 8524 | 5516 | 1864 | 0 | 0 | 0 | 0 | 15904 | 70.69 | 3 |
| 6 | Water source/pumping unit unavailable | 2256 | 2334 | 4288 | 3857 | 415 | 0 | 0 | 13150 | 58.44 | 6 |
| 7 | Not easy to maintain – before/after installation | 752 | 212 | 4661 | 2025 | 1990 | 563 | 608 | 10810 | 48.05 | 7 |
Table 5: Final Ranking of constraints
| Constraint | Garrett Score | Rank |
| Rainfall in abundance | 76.97 | 1 |
| Expensive to install | 73.49 | 2 |
| Less subsidies from Govt. | 70.69 | 3 |
| Challenges in receiving subsidies | 65.58 | 4 |
| Unaware of Micro-irrigation | 65.37 | 5 |
| Water source/pumping unit unavailable | 58.44 | 6 |
| Not easy to maintain – before/after installation | 48.05 | 7 |
The analysis of constraints affecting micro-irrigation adoption reveals that the high cost of investment is the most significant barrier, despite government subsidies. Farmers are reluctant to adopt the system without financial assistance due to limited awareness. Difficulties in obtaining subsidies rank second, attributed to procedural complexities. Lack of awareness is another major challenge, as many farmers are unfamiliar with the long-term benefits of micro-irrigation. Abundant rainfall in the region further reduces the perceived necessity of such systems. Inadequate subsidy levels and the non-availability of water sources or pumps also hinder adoption. Maintenance issues, such as clogged drippers, contribute to discontinuation concerns. Addressing these financial, technical, and procedural barriers will be crucial for wider adoption and sustainability of micro-irrigation systems.
Hypothesis testing results
To test the results, statistically, following set of hypotheses was taken during this phase of the study:
Hypothesis -A
H0: Continuation of MI is linked with financial subsidy
H1: Continuation of MI is not linked with financial subsidy
Hypothesis -B
H0: Ownership of water source has a direct linkage with the type of water source
H1: There is no relationship between ownership of water source (owned/hired) & type of water source (pump/pond etc.)
Table 6: ANOVA results for Hypothesis A.
| Anova: Single Factor | |||||||||||
| Groups | Count | Sum | Average | Variance | |||||||
| Continual of Adoption of MI | 224 | 269 | 1.200893 | 0.161255 | |||||||
| Govt Subsidy Received | 224 | 254 | 1.133929 | 0.116512 | |||||||
| Anova | |||||||||||
| Source of Variation | SS | df | MS | F | P-value | F crit | |||||
| Between Groups | 0.502232 | 1 | 0.502232 | 3.616216 | 0.057863 | 3.862393 | |||||
| Within Groups | 61.94196 | 446 | 0.138883 | ||||||||
| Total | 62.4442 | 447 | |||||||||
As the p-value is greater than 0.05 for an alpha of 0.05, we accepted the null hypothesis, i.e. Continuation of micro-irrigation is linked with financial subsidy.
Table 7: ANOVA results for Hypothesis B
| Anova: Single Factor | ||||||
| SUMMARY | ||||||
| Groups | Count | Sum | Average | Variance | ||
| Source of Water | 225 | 309 | 1.373333 | 0.235 | ||
| Type of Water Source | 225 | 278 | 1.235556 | 0.180873 | ||
| ANOVA | ||||||
| Source of Variation | SS | df | MS | F | P-value | F crit |
| Between Groups | 2.135556 | 1 | 2.135556 | 10.27023 | 0.001449 | 3.862299 |
| Within Groups | 93.15556 | 448 | 0.207937 | |||
| Total | 95.29111 | 449 | ||||
As the p-value is less than 0.05 for an alpha of 0.05, we reject the null hypothesis, i.e. ownership of water source has a direct linkage with the type of water source.
During this phase of the research, it was pretty clear that the financial barriers play a major deterrent for the farmers to adopt micro-irrigation solutions. In spite of financial subsidies from the Government, there is a need for micro-credit schemes or low-interest loans can ease financial burdens. Lot of work has to be done by the stakeholders for increasing awareness and bridging the knowledge gap so that technical ease is maintained and adoption can be sustainable.
Table 8: Summary of results on ranking of variables
| Barrier Category | Key Issues Identified | Ranking |
| Financial Barriers | High cost despite 55% subsidy coverage. The Garrett ranking and ANOVA results confirm that financial constraints are the primary deterrent to micro-irrigation adoption. | #1 |
| Bureaucratic Delays | Long waiting times and complex application procedures | #2 |
| Knowledge & Awareness Gaps | Lack of information on fertigation, maintenance, and benefits | #3 |
| Climatic feature | Abundance of rainfall in the region. Historically the region has received large volume of water which is largely unmanaged. This creates a perception about abundance of water; however, rainfall cannot be taken for granted owing to many factors. | #4 |
| Water pump ownership | Source of water/pumping solution is a requirement for successful installation of micro-irrigation. This component is not subsidised and requires major financial involvement. | #5 |
| Environmental | Water impurity problems affecting system longevity | #6 |
| Technical Issues | Maintenance challenges, post installation due to lack of knowhow | #7 |
Phase 2 Results
The basic aim of this phase of study was to gain a first-hand experience on field micro irrigation system for understanding the constraints. Essentially to irrigate any crop productively, it is crucial to analyse the availability of water in the area and water required by the crop at various stages of its growth. Water loss from any crop or plant is a combination of evaporation from the soil surface and transpiration from the plant. Evaporation and transpiration occur simultaneously and it is quite difficult to distinguish them. Therefore, the concept of evapotranspiration (ET) is advocated by experts including FAO.21 The crop water need (ET crop) has been defined as the depth (or amount) of water needed to compensate for the water loss through evapotranspiration.
The ET Crop can be calculated by the following formula:
ETo × Kc = ET crop
| where, | ET crop = | crop evapotranspiration or crop water need (mm/day) |
| Kc = | crop factor | |
| ETo = | reference evapotranspiration (mm/day) |
The reference evapotranspiration, ETo can be calculated using the Penman-Monteith Equation (FAO, 1998a)21
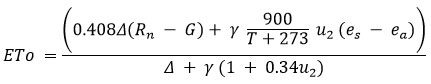
where,
ETo = reference evapotranspiration [mm day-1],
Rn = net radiation at the crop surface [MJ m-2 day-1],
G = soil heat flux density [MJ m-2 day-1],
T = mean daily air temperature at 2 m height [°C],
u2 = wind speed at 2 m height [m s-1],
es = saturation vapour pressure [kPa],
ea = actual vapour pressure [kPa],
es – ea = saturation vapour pressure deficit [kPa],
= slope vapour pressure curve [kPa °C-1],
= psychrometric constant [kPa °C-1].
To design and install a working micro-irrigation system, it is very essential to find out the correct crop water requirements at the location. The crop water requirement largely depends on the growth stage of the crop or plant as shown in the figure 4.
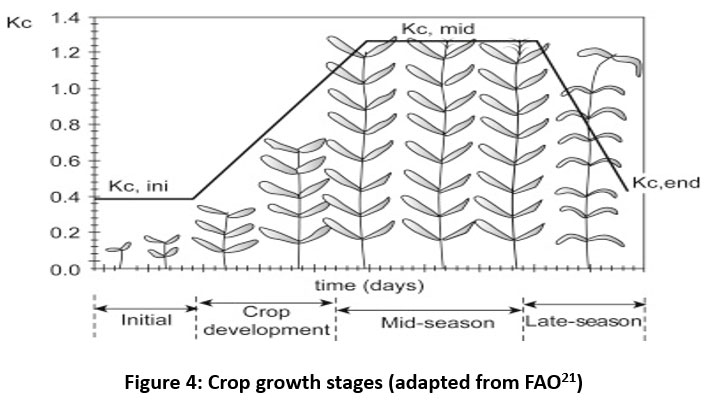 |
Figure 4: Crop growth stages (adapted from FAO21) |
Calculation of ETo and ETcrop, manually requires numerous data and it may result in inaccurate results. Therefore, FAO advocates use of CROPWAT22 model for calculation of irrigation water requirements while scientifically designing an irrigation system for a crop. Climate data is available from FAO’s CLIMWAT23 software which can then be used in the CROPWAT model to arrive at the crop water requirements for the location of interest. In this project, CROPWAT 8.0 has been used to analyse the climate data (15 years avg. with minimum & maximum temperature; wind speed; sun radiation and Eto); rainfall data (15 years avg); crop data from FAO database and soil data from NESAC-ISRO. Each data (software output) for the project site obtained using FAO- CROPWAT 8.0 and CLIMWAT 2.0 [19] is presented for understanding and clarity.
Table 9: Climatic data for study location-Kamrup (15 yrs avg.)
| Month | Min Temp (°C) | Max Temp (°C) | Humidity (%) | Wind (km/day) | Sun (hours) | Rad (MJ/m²/day) | ETo (mm/day) |
| January | 10.5 | 23.6 | 77 | 52 | 7.1 | 13.8 | 1.97 |
| February | 11.9 | 26 | 65 | 69 | 7.5 | 16.2 | 2.68 |
| March | 15.7 | 29.9 | 57 | 95 | 6.8 | 17.7 | 3.7 |
| April | 19.9 | 30.7 | 61 | 147 | 6.7 | 19.3 | 4.51 |
| May | 22.4 | 31 | 74 | 95 | 5.9 | 18.8 | 4.14 |
| June | 24.8 | 31.9 | 81 | 95 | 3.4 | 15.1 | 3.55 |
| July | 25.3 | 31.7 | 81 | 69 | 3.3 | 15 | 3.46 |
| August | 25.3 | 32.1 | 82 | 69 | 3.8 | 15.3 | 3.48 |
| September | 24.4 | 31.4 | 81 | 69 | 4.5 | 14.9 | 3.35 |
| October | 22.8 | 30.2 | 81 | 69 | 6.3 | 15.3 | 3.18 |
| November | 16.8 | 27.5 | 83 | 69 | 7.5 | 14.6 | 2.6 |
| December | 11.8 | 24.4 | 83 | 52 | 7 | 13.1 | 1.96 |
| Average | 19.2 | 29.2 | 76 | 79 | 5.8 | 15.7 | 3.22 |
Table 10: Monthly rainfall data for study location (15 years avg.)
| Month | Rain (mm) | Eff Rain (mm) |
| January | 9 | 8.9 |
| February | 18 | 17.5 |
| March | 51 | 46.8 |
| April | 159 | 118.6 |
| May | 219 | 142.3 |
| June | 320 | 157 |
| July | 359 | 160.9 |
| August | 243 | 148.5 |
| September | 182 | 129 |
| October | 86 | 74.2 |
| November | 23 | 22.2 |
| December | 7 | 6.9 |
| Total | 1676 | 1032.7 |
Table 11: Dry crop data (Citrus sp.)
| Stage | Initial | Develop | Mid | Late | Total |
| Length (days) | 60 | 90 | 120 | 95 | 365 |
| Kc Values | 0.7 | 0.65 | 0.7 | ||
| Rooting depth (m) | 1.4 | 1.4 | 1.4 | ||
| Critical depletion | 0.5 | 0.5 | 0.5 | ||
| Yield response f. | 1 | 1 | 1 | 1 | 1 |
| Crop height (m) | 4 | ||||
Table 12: Soil data for study location
| Parameter | Value | Unit |
| Soil Name | Medium (loam) | |
| Total available soil moisture (FC – WP) | 290 | mm/meter |
| Maximum rain infiltration rate | 40 | mm/day |
| Maximum rooting depth | 900 | centimeters |
| Initial soil moisture depletion (as % TA) | 0 | % |
| Initial available soil moisture | 290 | mm/meter |
Table 13: CROPWAT output- crop water requirements for Citrus sp.
| Month | Decade | Stage | Kc coeff | ETc (mm/day) | ETc (mm/dec) | Eff Rain (mm/dec) | Irr. Req. (mm/dec) |
| Jun | 2 | Init | 0.7 | 2.49 | 24.9 | 52.8 | 0 |
| Jun | 3 | Init | 0.7 | 2.47 | 24.7 | 53.1 | 0 |
| Jul | 1 | Init | 0.7 | 2.44 | 24.4 | 53.7 | 0 |
| Jul | 3 | Init | 0.7 | 2.42 | 24.2 | 53.7 | 0 |
| Aug | 1 | Deve | 0.7 | 2.43 | 24.3 | 51.8 | 0 |
| Aug | 2 | Deve | 0.7 | 2.41 | 24.1 | 51.8 | 0 |
| Aug | 3 | Deve | 0.67 | 2.34 | 23.4 | 47.5 | 0 |
| Sep | 1 | Deve | 0.67 | 2.27 | 22.7 | 46.3 | 0 |
| Sep | 2 | Deve | 0.66 | 2.2 | 22 | 46 | 0 |
| Sep | 3 | Deve | 0.64 | 2.17 | 21.7 | 30.7 | 0 |
| Oct | 1 | Deve | 0.62 | 1.97 | 19.7 | 30.6 | 1.1 |
| Oct | 3 | Deve | 0.61 | 1.87 | 18.7 | 18.9 | 1.1 |
| Nov | 2 | Mid | 0.6 | 1.67 | 16.7 | 18.9 | 1.1 |
| Nov | 3 | Mid | 0.59 | 1.55 | 15.5 | 15.2 | 1.1 |
| Dec | 2 | Mid | 0.59 | 1.42 | 14.2 | 14.5 | 1.1 |
| Dec | 3 | Mid | 0.59 | 1.26 | 12.6 | 14.5 | 1.1 |
| Dec | 3 | Mid | 0.59 | 1.17 | 11.7 | 14.3 | 1.1 |
| Jan | 2 | Mid | 0.59 | 1.17 | 11.7 | 13.9 | 1.1 |
| Jan | 3 | Mid | 0.59 | 1.45 | 14.5 | 13.9 | 1.1 |
| Feb | 2 | Mid | 0.6 | 2.03 | 20.3 | 13.8 | 3.9 |
| Feb | 3 | Mid | 0.59 | 1.79 | 17.9 | 13.8 | 3.9 |
| Mar | 2 | Late | 0.6 | 2.03 | 20.3 | 13.8 | 5.9 |
| Mar | 2 | Late | 0.63 | 2.19 | 21.9 | 13.8 | 5.9 |
| Mar | 3 | Late | 0.63 | 2.19 | 21.9 | 13.8 | 5.9 |
| Apr | 2 | Late | 0.63 | 2.19 | 21.9 | 13.8 | 5.9 |
| Apr | 2 | Late | 0.63 | 2.27 | 22.7 | 13.8 | 5.9 |
| Apr | 3 | Late | 0.63 | 2.36 | 23.6 | 13.8 | 5.9 |
| May | 2 | Late | 0.63 | 2.36 | 23.6 | 13.8 | 5.9 |
| May | 2 | Late | 0.63 | 2.36 | 23.6 | 13.8 | 5.9 |
| Jun | 2 | Late | 0.63 | 2.36 | 23.6 | 13.8 | 5.9 |
The drip-irrigation system was installed at the project location after reviewing the results of CROPWAT 8.0 so that the water is optimally utilized and applied for the crop. During this phase of the study, it was understood that the design of drip irrigation system depends on many parameters, including topography, soil type, crop, field layout, local conditions of weather, available resources of irrigation and financial options. Since the project site is located in hilly region, water pressure drop was observed uphill, therefore sectional irrigation was planned and accordingly the layout followed the contours of the area. The project is running successfully and future course of action may include analysis of production and productivity of the crop at the project site.
Discussion
The adoption of micro-irrigation in Assam faces significant challenges due to the current implementation approach by stakeholders. Farmers in hilly regions and those with small landholdings encounter greater difficulties in accessing and utilizing this technology. The decision to adopt micro-irrigation is often driven by financial feasibility rather than voluntary preference. Farmers who are proactive and well-informed about the benefits of this technology are more inclined to adopt it. The two phases of this study highlight the challenges and constraints as well as present the correct approach to design any micro-irrigation system, which should be based upon climatic & soil parameters. The solution must by customised with inputs from the farmer/beneficiary to reap desired benefits.
Conclusion
This study has identified challenges towards effective adoption of micro-irrigation systems in Assam. In order to enhance the adoption, the authors recommend that the accessible financing options must be available to the users, apart from government subsidies. The farmers should select the crops carefully, given the high cost of initial investments and must follow a scientific system design using tools like CROPWAT, CLIMWAT to design the micro-irrigation systems as per seasonal crop-water requirements. This requires the government and other stakeholders to create more technical awareness on the installation & post-installation activities in order to ensure effective implementation of these excellent water-saving technologies for irrigating crops. By addressing these challenges through financial support, scientific planning, and awareness initiatives, micro-irrigation adoption in Assam can be significantly improved.
Acknowledgement
The author would like to thank IIT Guwahati , in particular the School of Agro & Rural Technology for granting the Ph.D. research work. The author is also profoundly grateful to the Department of Agriculture, Govt. of Assam for their guidance & support during field survey.
Funding Sources
The author(s) received no financial support for the research, authorship, and/or publication of this article.
Conflicts of Interest
The authors do not have any conflict of interest.
Data Availability Statement
Data may be provided on request.
Ethics Statement
This research did not involve human participants, animal subjects, or any material in a way that requires ethical approval.
Informed Consent Statement
This study did not involve human participant in a way where informed & written consent was required. The feedbacks were collected during field survey by informing them it is a part of research work to understand their challenges and issues while implementing micro-irrigation in their farms. No personal information has been disclosed anywhere in this report or during analysis.
Author Contributions
Manoj Kumar Verma: Conceptualization, Methodology, Data collection, Analysis, Writing – Original Draft.
Amarendra Kumar Das: Review, Editing, Supervision
References
- Chand R, Rana J, Ministry of Statistics and Program Implementation (MOSPI), et al. AGRICULTURE AND FOOD MANAGEMENT: SECTOR OF THE FUTURE. In: Economic Survey 2024-25. https://www.indiabudget.gov.in/economicsurvey/doc/eschapter/echap09.pdf
- Arun Kumar, Anil Kumar Sharma, Yadav RK, Meitei S, Arora N, Gaur DK. Agricultural Statistics at a Glance 2022.; 2022. https://desagri.gov.in/wp-content/uploads/2023/05/Agricultural-Statistics-at-a-Glance-2022.pdf
- Suhag R. Overview of Ground Water in India.; 2016. https://prsindia.org/files/policy/policy_analytical _reports/ 1455682937–Overview%2520of%2520 Ground%2520Water%2520in%2520India_0.pdf
- Kumar MD, Sharma BR, Singh OP. Water saving and yield enhancing micro-irrigation technologies: how far can they contribute to water productivity in Indian agriculture? 2009. https://hdl.handle.net/10568/36828
- Cornish GA. Pressurised irrigation technologies for smallholders in developing countries – a review. Irrigation and Drainage Systems. 1998;12(3):185-201. doi:1023/a:1006037817381
CrossRef - Polak P, Nanes B, Adhikari D. A LOW COST DRIP IRRIGATION SYSTEM FOR SMALL FARMERS IN DEVELOPING COUNTRIES1. JAWRA Journal of the American Water Resources Association. 1997;33(1):119-124. doi:1111/j.1752-1688.1997.tb04088.x
CrossRef - Ali MH, Talukder MSU. Increasing water productivity in crop production—A synthesis. Agricultural Water Management. 2008;95(11):1201-1213. doi:1016/j.agwat.2008.06.008
CrossRef - Kumar MD, Turral H, Sharma B, Amarasinghe U, Singh OP. WATER SAVING AND YIELD ENHANCING MICRO-IRRIGATION TECHNOLOGIES IN INDIA : WHEN AND WHERE CAN THEY BECOME BEST BET TECHNOLOGIES? Abstract. https://publications.iwmi.org/pdf/H041700.pdf
- Saha MCh, Das P, Sarma M, et al. Economic Survey, Assam, 2023-24.; 2023.
- PMKSY (Per Drop More Crop) | Directorate of Horticulture & Food Processing | Government of Assam, India. Accessed February 5, 2025. https://dirhorti.assam.gov.in/schemes/pradhan-mantri-krishi-sinchayee-yojana-pmksy-per-drop-more-crop-pdmc
- Jha R. Introduction and the state of Indian agriculture. In: Palgrave Macmillan UK eBooks. ; 2018:3-33. doi:1057/978-1-349-95342-4_1
CrossRef - Verma MK, Das AK. Design interventions for improvement of adoption rate of micro-irrigation in Assam. In: Smart Innovation, Systems and Technologies. ; 2021:151-164. doi:1007/978-981-16-0119-4_13
CrossRef - Vezzoli C, Kohtala C, Srinivasan A, et al. Product-Service System Design for Sustainability. Greenleaf Publishing Limited; 2014. https://re.public.polimi.it/retrieve/e0c31c08-1b33-4599-e053-1705fe0aef77/Product-Service%20System%20Design%20for%20Sustainability_PART%20I.pdf
- , Aleeswari & Merline W, Lilly & Martin, Nivetha. (2019). Study on Industrial Problems using Garrett Ranking Technique. BULMIM Journal of Management and Research. 4. 1. 10.5958/2455-3298.2019.00001.1.
CrossRef - Gal P y. L, Dugué P, Faure G, Novak S. How does research address the design of innovative agricultural production systems at the farm level? A review. Agricultural Systems. 2011;104(9):714-728. doi:1016/j.agsy.2011.07.007
CrossRef - Meynard JM, Jeuffroy MH, Bail ML, Lefèvre A, Magrini MB, Michon C. Designing coupled innovations for the sustainability transition of agrifood systems. Agricultural Systems. 2016;157:330-339. doi:1016/j.agsy.2016.08.002
CrossRef - Cerf M, Jeuffroy MH, Prost L, Meynard JM. Participatory design of agricultural decision support tools: taking account of the use situations. Agronomy for Sustainable Development. 2012;32(4):899-910. doi:1007/s13593-012-0091-z
CrossRef - Elzen B, Bos B. The RIO approach: Design and anchoring of sustainable animal husbandry systems. Technological Forecasting and Social Change. 2016;145:141-152. doi:1016/j.techfore.2016.05.023
CrossRef - Lamprinopoulou C, Renwick A, Klerkx L, Hermans F, Roep D. Application of an integrated systemic framework for analysing agricultural innovation systems and informing innovation policies: Comparing the Dutch and Scottish agrifood sectors. Agricultural Systems. 2014;129:40-54. doi:1016/j.agsy.2014.05.001
CrossRef - Verma MK, Das AK. Design of system for drip irrigation for hilly terrains in Assam. In: Smart Innovation, Systems and Technologies. ; 2023:561-570. doi:1007/978-981-99-0264-4_46
CrossRef - Allen RG Jr, Pereira LS, Raes D, Smith M, FAO, Water Resources, Development and Management Service. Crop Evapotranspiration (Guidelines for Computing Crop Water Requirements).; 1994. http://www.climasouth.eu/sites/default/files/FAO%2056.pdf
- CROPWAT | Land & Water | Food and Agriculture Organization of the United Nations | Land & Water | Food and Agriculture Organization of the United Nations. Accessed February 5, 2025. https://www.fao.org/land-water/databases-and-software/cropwat/en/
- CLIMWAT | Land & Water | Food and Agriculture Organization of the United Nations | Land & Water | Food and Agriculture Organization of the United Nations. Accessed February 5, 2025. https://www.fao.org/land-water/databases-and-software/climwat-for-cropwat/en/