Introduction
Climate change research is essential for understanding how global shifts in temperature, precipitation, and extreme weather events affect ecosystems, human health, agriculture, and infrastructure.1–3 These studies are vital for developing effective strategies to mitigate and adapt to these impacts. Global Circulation Models (GCMs) are complex computer-based models that simulate Earth’s climate system by representing interactions between the atmosphere, oceans, land surface, and ice. These models use mathematical equations to predict climate variables, such as temperature and precipitation, under different greenhouse gas scenarios. While GCMs are highly effective in modeling large-scale climate patterns, they struggle to capture fine-scale climatic variations at regional and local levels, limiting their direct application to impact assessments. General Circulation Models (GCMs), despite their significant contributions to our understanding of global climate patterns, exhibit limitations in capturing fine-scale climatic variations at the regional level. This inherent limitation hinders their direct application to local-scale impact assessments. To make GCM data useful for specific regions, downscaling techniques are used. Downscaling converts large-scale climate data from GCMs into more detailed, local-level predictions. This is important for understanding temperature changes that impact agriculture, water resources, and ecosystems. Downscaling techniques offer a valuable approach to bridge the gap by translating coarse-resolution GCM outputs into higher-resolution climate information relevant for specific regions.4–7 Two primary methodologies are employed for downscaling: statistical downscaling and dynamical downscaling.8–10
Statistical Downscaling
Statistical downscaling methods aim to establish a robust statistical relationship between large-scale atmospheric variables, derived from GCM outputs, and local-scale daily maximum temperature (Tmax) observations. This method uses historical climate data to predict future climate conditions at the local level, making it highly efficient and less computationally demanding. By using this relationship, we can project more accurate, region-specific Tmax values. The specific mathematical formulation of this relationship can vary across different studies, as exemplified by Equation 1.11,12
![]()
where, Υ0 and Υj = Intercept between predictor and predictand, Xij= Predictor values for selected predictors and ei= Bias correction value.
Dynamic Downscaling
In contrast to dynamic downscaling, which utilizes computationally intensive Regional Climate Models (RCMs) nested within Global Circulation Models (GCMs), statistical downscaling provides a more efficient and computationally less demanding approach.13 While dynamic downscaling necessitates substantial computational resources and significant time investment, statistical downscaling can often achieve comparable results with a reduced computational burden.5
In this research, we utilize a specialized statistical downscaling technique known as the Random Forest (RF) algorithm. RF is an ensemble machine learning approach that constructs a collection of decision trees (specifically, 100 trees) and integrates their outputs to enhance prediction accuracy. This methodology is particularly adept at managing intricate climate data by examining the interactions among various variables and forecasting future results. The RF algorithm significantly boosts the precision of Tmax projections by assimilating insights from historical data and applying this understanding to anticipate future conditions.
This research capitalizes on the computational efficiency of statistical downscaling to forecast future daily maximum temperature (Tmax) values for the Aurangabad region.
Materials and Methods
Study Area
The study area for this investigation is the Aurangabad region, located at 19°53′N latitude and 75°19′E longitude within the state of Maharashtra, India. This region encompasses an area of approximately 10,100 km².
Data Collection
For the statistical downscaling analysis, observed daily maximum temperature (Tmax) data for the Aurangabad region were sourced from the Indian Meteorological Department (IMD) covering the period from 1961 to 2005. This time frame was selected because corresponding large-scale climate data from the NCEP dataset is available for the same years. Utilizing the same period for both datasets facilitates the development of an accurate relationship between local temperature and extensive climate patterns. Hence, this period is regarded as the baseline for conducting the analysis. The requisite large-scale climate variables for the downscaling model were obtained from the CMIP5 dataset accessible via the Climate Impact Scenarios website.
Methodology
This section details the methodological framework utilized in this research to downscale daily maximum temperature (Tmax) values for the Aurangabad region employing the Random Forest technique. In contrast to conventional statistical downscaling methods that frequently depend on linear assumptions, the Random Forest algorithm offers a more adaptable, data-driven approach that effectively captures complex, non-linear relationships between predictors and Tmax. This results in enhanced projection accuracy, thereby making them more dependable for climate impact assessments. The downscaling process based on Random Forest in this study encompasses the following primary steps.
Feature Ranking: Identifying Key Predictors
Before initiating the downscaling process, a crucial preliminary step consisted of pinpointing the most significant large-scale climate variables that influence Tmax variations. These variables are sourced from the CMIP5 model, which offers a range of potential climate predictors for future projections. In this analysis, a feature ranking technique utilizing the Random Forest algorithm within the Google Colab platform was implemented to evaluate the relative importance of each predictor. Random Forest determines the most impactful variables by assessing the extent to which each contributes to enhancing prediction accuracy across multiple decision trees. It assigns higher importance to variables that considerably minimize errors, ensuring that only the most pertinent predictors are utilized. This methodology aids in eliminating extraneous data, minimizing noise, and improving the model’s accuracy. The results of this process identified the top three most influential predictors for the subsequent Tmax downscaling.
Data Partitioning: Training and Testing Datasets
Subsequently, the dataset from the baseline period of 1961-2005 was divided into training and testing subsets. A commonly adopted practice involves an 80/20 split, designating 80% of the data for model training and the remaining 20% for comprehensive model evaluation. This 80/20 ratio is prevalent in machine learning as it offers a balanced approach to providing ample data for effective model learning (80%) while ensuring sufficient unseen data (20%) for a reliable assessment of the model’s predictive performance. The 20% testing data functions as an unbiased sample, facilitating the evaluation of the model’s generalization capabilities on new, unseen data. In contrast to certain prior studies that employed fixed validation periods, this research implements a randomized data split, which further mitigates bias and enhances the robustness and generalizability of the findings, confirming that the model is assessed on a diverse data subset.
Model Training and Evaluation
A Random Forest model, comprising 100 decision trees, was initialized and trained using historical Tmax data in conjunction with the identified key predictors from the training dataset. The selection of 100 trees is based on empirical results indicating that this quantity typically strikes a favorable balance between model accuracy and computational efficiency. While an increased number of trees can enhance model performance, 100 trees are generally adequate to capture intricate patterns within the data. Upon completion of the training phase, the model’s predictive performance underwent rigorous evaluation by contrasting the predicted Tmax values with the corresponding observed values in both the training and testing datasets. The Random Forest ensemble learning methodology, which aggregates multiple decision trees, diminishes the risk of overfitting and bolsters the robustness of the projections.
Assessing Model Performance
The effectiveness of the trained Random Forest model was meticulously evaluated through a combination of visual inspections utilizing scatter plots and quantitative assessments employing the coefficient of determination (R-squared). A high R-squared value indicates strong concordance between the predicted and observed Tmax values during the training and testing periods within the baseline timeframe of 1961-2005, demonstrating the model’s capability to accurately encapsulate the complex relationship between the predictors and Tmax variations.
Projecting Future Tmax Values
Following the attainment of a favorable coefficient of determination (R2) value between observed and predicted Tmax values during the baseline period (1961-2005), the trained Random Forest model was subsequently utilized to forecast future Tmax values for the Aurangabad region. This was achieved by applying the trained model to future climate projections derived from the CMIP5 model, incorporating the identified key predictors for forthcoming scenarios. Diverging from traditional methodologies that rely solely on historical trends, this study integrates machine learning-based statistical downscaling with CMIP5 outputs, presenting a more data-driven and adaptable approach for future climate predictions.
Results and Discussion
Results for Feature Ranking
To identify the most influential large-scale climate variables impacting Tmax variations, a feature ranking technique was employed utilizing the Random Forest algorithm. The results of this analysis, depicting the relative importance of each predictor, are presented in Figure 1.
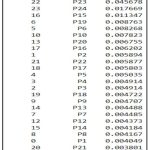 |
Figure 1: Feature Ranking Results |
In the feature ranking process, 25 large-scale climate variables provided by the GCM were considered and labeled as P1, P2, P3, … P25 for easy reference. These predictors represent different atmospheric and surface conditions that can influence Tmax variations. Using the Random Forest-based feature ranking method, each predictor was assigned an importance score based on how much it improved the model’s accuracy. The higher the score, the more relevant the predictor for downscaling Tmax. Based on the feature ranking results, the following three large-scale climate variables were selected as the most influential predictors for downscaling Tmax: P25 (Temperature at the ground level), P23 (1000 hPa specific humidity), and P24 (Specific Humidity at the ground level).
Results for Comparison between Predicted and Actual Tmax
The relationship between the predicted and observed Tmax values was rigorously evaluated for both the training and testing datasets. This evaluation encompassed visual inspection using scatter plots and quantitative assessment using the coefficient of determination (R-squared).
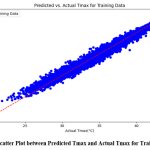 |
Figure 2: Scatter Plot between Predicted Tmax and Actual Tmax for Training Data |
The scatter plot in Figure 2 for the training dataset illustrates a strong positive correlation between the predicted and observed daily maximum temperature (Tmax) values. Figure 4 presents the scatter plot depicting the relationship between predicted Tmax and actual Tmax for the independent testing dataset.
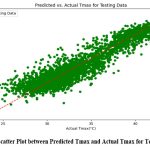 |
Figure 3: Scatter Plot between Predicted Tmax and Actual Tmax for Testing Data |
The scatter plot in Figure 3 for the testing dataset also demonstrates a strong agreement between the predicted and observed Tmax values. The data points exhibit a close proximity to the diagonal line, indicating that the model’s predictions are consistent with the unseen testing data. To quantitatively assess this agreement, the coefficient of determination (R-squared) was calculated for both the training and testing datasets. The R-squared values are summarized in Table 1.
Table 1: Coefficients of Determination between Predicted and Actual Tmax for Training and Testing Dataset
| Sr. No. | Dataset | R2 |
| 1 | Between Predicted Tmax and Actual Tmax for Training Dataset | 0.981 |
| 2 | Between Predicted Tmax and Actual Tmax for Test Dataset | 0.866 |
Table 1 provides the R-squared values for the training and testing datasets, illustrating a strong correlation between the predicted and observed daily maximum temperatures (Tmax). This indicates that the three identified predictors (P25, P23, and P24) successfully encapsulated the primary factors influencing Tmax variability in the Aurangabad region. Consequently, the Random Forest model, trained with these significant predictors, was employed to project future Tmax values for the region.
Projected Tmax Changes Through Downscaling
The anticipated temperature variations were analyzed under three specific Representative Concentration Pathway (RCP) scenarios: RCP 2.6, RCP 4.5, and RCP 8.5, which represent differing levels of projected future greenhouse gas concentrations. The evaluation was conducted utilizing two distinct temporal frameworks:
Long-Term Projections: This analysis concentrated on anticipated Tmax changes over three forthcoming decades: the 2020s (2011-2040), the 2050s (2041-2070), and the 2080s (2071-2099). Short-Term Intervals: This method offered a more detailed examination by considering Tmax projections for ten separate 10-year intervals, ranging from 2006-2015 to 2096-2099.
Projected Outcomes across Three Future Decades
The anticipated shifts in monthly average daily Tmax values for the upcoming decades (2020s, 2050s, and 2080s) were compared with the baseline period. This evaluation was performed for all three RCP scenarios (RCP 2.6, RCP 4.5, and RCP 8.5), and the findings are summarized in Table 2.
Table 2: Increase in Tmax under Different RCPs for Three Future Series With Respect to the Baseline Period
| Model | RCP | Future Series | Increasing Tmax in 0C with respect to baseline period |
| CMIP5 (CanESM2) | RCP 2.6 | 2011-2040 | 0.51 |
| 2041-2070 | 0.96 | ||
| 2071-2099 | 0.87 | ||
| RCP 4.5 | 2011-2040 | 0.7 | |
| 2041-2070 | 1.07 | ||
| 2071-2099 | 1.44 | ||
| RCP 8.5 | 2011-2040 | 0.56 | |
| 2041-2070 | 1.57 | ||
| 2071-2099 | 2.46 |
The projected changes in monthly average daily Tmax values across the three future decades (2020s, 2050s, and 2080s) were compared to the baseline period, revealing varying trends under the different RCP scenarios:
RCP 2.6: Under this scenario, Tmax is expected to experience a rise, reaching an increase of up to 0.87°C by the end of the 21st century (2099).
RCP 4.5: A more noticeable rise in Tmax is anticipated for RCP 4.5, with projections indicating an increase of as much as 1.44°C by 2099.
RCP 8.5: The most significant warming is projected under RCP 8.5, where Tmax could increase by up to 2.46°C by the year 2099.
Results for Short-Term Periods
The downscaled Tmax values were analyzed over 10-year intervals, spanning from 2006-2015 to 2096-2099. These shorter time spans offer a finer level of detail in understanding projected Tmax changes. The outcomes are presented in graphical form for each Representative Concentration Pathway (RCP) scenario: RCP 2.6, RCP 4.5, and RCP 8.5 (Figures 5, 6, and 7). To evaluate the trends, the increases in monthly average daily Tmax values for each 10-year period were compared to the baseline period. These comparisons are illustrated in the figures.
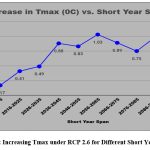 |
Figure 4: Increasing Tmax under RCP 2.6 for Different Short Year Spans |
Figure 4 illustrates a rise in monthly average daily Tmax values across each 10-year period when compared to the baseline period. This upward trend indicates a warming climate over the upcoming decades under RCP 2.6. However, the pace of this increase appears to decelerate toward the end of the 21st century (2099), with projected rises reaching up to 1°C.
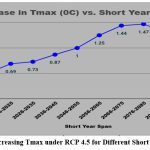 |
Figure 5: Increasing Tmax under RCP 4.5 for Different Short Year Spans |
Figure 5 displays a more significant upward trend in monthly average daily Tmax values across each 10-year period compared to the baseline period. This trend remains consistent throughout the analyzed timeframe, with an acceleration observed toward the end of the 21st century (2099). Projections suggest increases of up to 1.46°C under RCP 4.5.
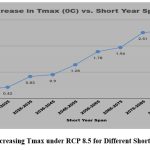 |
Figure 6: Increasing Tmax under RCP 8.5 for Different Short Year Spans |
Figure 6 highlights a continuous increase in monthly average daily Tmax values across each 10-year period, showing a significant rise that persists well into the year 2099, reaching up to 2.75°C. The figure clearly depicts an ongoing upward trend in monthly average daily Tmax values when compared to the baseline, indicating a substantial and steady warming throughout the examined period under RCP 8.5. By the end of the 21st century (2099), projections show the most pronounced rise among all RCP scenarios, peaking at 2.75°C.
After analysis of Tmax results under each RCP we have found, the increasing trend aligns with the IPCC-projected patterns under RCP 2.6, 4.5, and 8.5 scenarios, where higher RCPs correspond to a steeper rise in temperature, confirming the anticipated climate warming trends.
Recognizing the anticipated increases in Tmax is essential for various reasons:
Impact on Water Demand: As Tmax escalates, the rate of evaporation from soil and water bodies correspondingly rises. This entails heightened water consumption for irrigation, as crops will necessitate increased water to mitigate the effects of elevated evaporation. Effectively addressing this growing demand will be critical for maintaining agricultural productivity and ensuring the sustainability of water resources.
Impact on Water Demand
As Tmax escalates, the rate of evaporation from soil and water bodies correspondingly rises. This entails heightened water consumption for irrigation, as crops will necessitate increased water to mitigate the effects of elevated evaporation. Effectively addressing this growing demand will be critical for maintaining agricultural productivity and ensuring the sustainability of water resources.
Water Quality Implications
Elevated Tmax can significantly influence water quality. Warmer temperatures may foster the proliferation of algae and other microorganisms in aquatic environments, potentially leading to harmful algal blooms. These occurrences can diminish water quality, necessitating enhanced treatment measures to guarantee the safety of water for consumption and various applications.
Strategic Planning and Adaptation
Accurate forecasts of Tmax are vital for effective water resource management and strategic planning. By comprehending the expected changes in Tmax, water managers can more accurately project future water demands and assess potential supply impacts. This understanding aids in the formulation of strategies to adapt to evolving climate conditions and optimize water resource management.
Groundwater Recharge Effects
Rising Tmax can adversely affect groundwater recharge rates. Elevated temperatures result in intensified evapotranspiration, leading to a decrease in the volume of water that penetrates the soil and replenishes groundwater reserves. This reduction in groundwater replenishment could exert considerable pressure on water resources, essential for both drinking and agricultural purposes.
Conclusion
In this study, the Random Forest technique was effectively applied for statistical downscaling, showcasing its ability to enhance temperature predictions at more localized levels. Known for its robustness and adaptability, this method was evaluated by comparing predicted Tmax values with actual data from both training and testing datasets. The strong correlation between predicted and observed values highlights the Random Forest method’s potential for downscaling climatic variables across different General Circulation Models (GCMs). The analysis confirms that Tmax values show a consistent rising trend across different future scenarios, aligning with global climate change projections. These results validate the trend detection analysis outlined by the IPCC, as the predicted Tmax values under RCP 2.6, 4.5, and 8.5 scenarios exhibit a continuous increase in alignment with the expected climate warming patterns. This highlights the significance of employing machine learning-based statistical downscaling for more reliable climate assessments. The study’s findings contribute to better climate adaptation planning, offering valuable insights for agriculture, water resource management, and environmental policies.
Acknowledgment
The authors are thankful to the India Meteorological Department (IMD) and the organization of Canadian Climate Impact Scenarios (CCIS) for providing the necessary data to conduct the present study.
Funding Statement
The authors declare that no funds or grants were received during the preparation of this manuscript.
Conflicts of Interest
The author declares that there is no conflict of interest regarding the publication of this paper.
Data availability
To carry out the statistical downscaling, we acquired observed maximum temperature (Tmax) values for Aurangabad region from IMD for the years 1961-2005. The GCM data for CMIP5 were sourced from the Climate Impact Scenarios site: https://climate-scenarios.canada.ca/?page=statistical-downscaling.
Ethics Statement
This research did not involve human participants, animal subjects, or any material that requires ethical approval.
Authors’ Contribution
Yogesh Barokar collected the data, developed the statistical model for downscaling and performed analysis.
Yogesh Barokar prepared the manuscript with a contribution from Dr. Vijaya Pradhan.
All authors contributed to the interpretation of the result.
References
- P Z S, K V J. Comparative study of innovative trend analysis technique with Mann-Kendall tests for extreme rainfall. Arab J Geosci. 2021;14(7):536. doi:10.1007/s12517-021-06906-w
CrossRef - Dixit S, Pandey KK, Shukla D. Decadal hydrological impact assessment of evolving land use and land cover in an Indian river basin: a multi-model approach. J Water Clim Change. 2024;15(9):4418-4433. doi:10.2166/wcc.2024.120
CrossRef - Ashraf Z, Kanwal B, Hussain I, Dashtipour K, Gogate M, Kanwal S. Statistical Downscaling Modeling for Temperature Prediction. Published online February 21, 2024. https://doi.org/10.1007/978-3-031-47590-0_8
CrossRef - Wilby R. Statistical downscaling of daily precipitation using daily airflow and seasonal teleconnection indices. Clim Res. 1998;10:163-178. doi:10.3354/cr010163
CrossRef - Wilby RL, Dawson CW, Barrow EM. sdsm — a decision support tool for the assessment of regional climate change impacts. Environ Model Softw. 2002;17(2):145-157. doi:10.1016/S1364-8152(01)00060-3
CrossRef - Wilby R, Charles S, Zorita E, Timbal B, Whetton P, Mearns L. Guidelines for Use of Climate Scenarios Developed from Statistical Downscaling Methods.
- Wilby RL, Dawson CW. Using SDSM Version 3.1 — A decision support tool for the assessment of regional climate change impacts. Published online 2004.
- Mahmood R, Babel MS, Jia S. Assessment of temporal and spatial changes of future climate in the Jhelum river basin, Pakistan and India. Weather Clim Extrem. 2015;10:40-55. doi:10.1016/j.wace.2015.07.002
CrossRef - Mahmood R, Babel MS. Future changes in extreme temperature events using the statistical downscaling model (SDSM) in the trans-boundary region of the Jhelum river basin. Weather Clim Extrem. 2014;5-6:56-66. doi:10.1016/j.wace.2014.09.001
CrossRef - Mahmood R, Babel MS. Evaluation of SDSM developed by annual and monthly sub-models for downscaling temperature and precipitation in the Jhelum basin, Pakistan and India. Theor Appl Climatol. 2013;113(1-2):27-44. doi:10.1007/s00704-012-0765-0
CrossRef - Saraf VR, Regulwar DG. Impact of Climate Change on Runoff Generation in the Upper Godavari River Basin, India. J Hazard Toxic Radioact Waste. 2018;22(4):04018021. doi:10.1061/(ASCE)HZ.2153-5515.0000416
CrossRef - Saraf VR, Regulwar DG. Assessment of Climate Change for Precipitation and Temperature Using Statistical Downscaling Methods in Upper Godavari River Basin, India. J Water Resour Prot. 2016;08(01):31-45. doi:10.4236/jwarp.2016.81004
CrossRef - Barokar YJ, Regulwar DG. Assessment of Temperature for Future Time Series Over Lower Godavari Sub-Basin, Maharashtra State, India. In: Timbadiya PV, Singh VP, Sharma PJ, eds. Climate Change Impact on Water Resources. Vol 313. Lecture Notes in Civil Engineering. Springer Nature Singapore; 2023:61-69. doi:10.1007/978-981-19-8524-9_6
CrossRef