
Introduction
The Indian biscuits market was valued at USD 3.19 billion in 2022 and is expected to grow at a CAGR of 4.13% during the forecast period from 2023 to 202945. The market is being driven by the increasing demand for healthy and clean-label products such as biscuits. Manufacturers can expand the market further by introducing innovative shapes, new flavours, attractive packaging, and more nutritious options to attract customers. Additionally, the growth of the biscuits market in India is driven by increasing urbanisation and rising disposable incomes, as people tend to spend more on snacks and convenience foods like biscuits45.
Wheat is a widely used staple grain in most countries and is used to make various finished foods like cakes, pastries, noodles, bread, pasta, and chapatis. The critical factors determining wheat’s suitability for a particular end-use are its grain texture (soft or hard), protein, and starch content. Grain hardness plays a significant role in determining the mechanical and structural characteristics of the grain and is typically defined as the force required to crush the grain or the grain’s resistance to mechanical forces. Based on grain hardness, wheat is classified into two types: soft wheat and hard wheat. Soft wheat is primarily used to make biscuits, while hard wheat is mainly used to produce pasta and bread16,42.
Wheat gluten proteins consist of monomeric gliadins and polymeric glutenins43. The quality and quantity of gliadins and glutenins primarily determine the functionality of wheat flour. Glutenins are composed of high molecular weight glutenin subunit (HMW-GS) and low molecular weight glutenin subunit (LMW-GS)53. The composition of HMW-GS and LMW-GS determines gluten elasticity and strength53. Soft wheat flour, chosen for its finer texture, higher amylose content, and lower gluten protein levels than hard wheat flour, is exceptionally well-suited for crafting biscuits, cakes, and crackers. Its finer particle size lends a smoother consistency to baked goods, while the elevated amylose content contributes to softer textures in biscuits and cakes and crispiness in crackers. With fewer gluten proteins, the gluten network in the soft wheat dough is weaker, resulting in the desired tender, crumbly textures in biscuits and cakes and flaky layers in crackers. Moreover, the variation in gluten protein content within soft wheat flour affects baking qualities, with significant correlations being observed between specific protein fractions and attributes, such as single kernel hardness index and mixograph water absorption or tolerance. Despite these positive associations, certain protein fractions may negatively affect break flour yield, biscuit diameter, and cake volume, highlighting the intricate interplay between soft wheat flour composition and its suitability for various baked goods40.
Research on soft wheat flour applications remains limited, particularly in products like biscuits and muffins. However, soft wheat flour was favoured for biscuit production due to its attributes, including a more significant spread factor, lower thickness, and tender texture. Soft wheat flour finer particle size and lower water absorption enhance its suitability for biscuits. Despite these advantages, there is a need for more exploration to understand and fully utilize its potential in various baked goods2. In India, soft wheat is cultivated in a limited area. Most wheat production areas prefer the production of hard-textured varieties.
As a result, hard wheat flour is commonly used to make biscuits, cakes, and other similar products. However, there have been efforts to address this issue. The ICAR-IARI Regional Station in Shimla has developed a variety of wheat called HS 490 with a lower grain hardness index22. While there has been limited research on glutenin characterization for biscuit quality in Indian soft wheat, certain combinations of high molecular weight glutenin subunits from hard wheat can improve biscuit quality in India, potentially mimicking the properties of soft wheat. This study aims to assess the texture, physiochemical properties, and biscuit quality of ancient wheat known as T. spherococcum and modern hard and soft wheat genotypes. T. spherococcum is an indigenous species of southern Pakistan and northwestern India. It was widely cultivated in ancient Indian cultures, but its cultivation declined in the early twentieth century, particularly after the Green Revolution. The introduction of high-yielding, disease-resistant modern wheat varieties in India that are also responsive to irrigation and fertilizers led to the decline of this ancient crop34. The study also analyzes the HMW-GS profiles and their effects on flour, dough mixing, and rheological properties. Additionally, the research examines the differences in agronomic characteristics, microscopic grain textures, flour physiochemical properties, and biscuit-making qualities between hard and soft wheat cultivars and ancient wheat.
Materials and Methods
Plant Material
Three hard wheat varieties (NI5439, MACS6478, MACS2496), two soft wheat varieties (HS 490, NIAW3170), and an ancient wheat T. spherococcum grains were obtained from MACS ARI (Maharashtra Association for the Cultivation of Science), Pune. The experiment was conducted using a random block design with three replications, where plot sizes were five lines of 1.5 m and each spaced 20 cm apart. All the sowing experiments were carried out during the regular season of 2020-2021 and 2021-2022 at MACS ARI, Hol, Baramati experimental farm. The fields are at an elevation of 538 m above sea level, with a latitude of 18° 31′ and a longitude of 73° 55’E. The soil composition comprises black cotton and mildly alkaline soils (pH 7.5). The recommended fertilisation dose was 120 kg N, 60 kg P, and 40 kg K per hectare. Half of the nitrogen quantity and the total dose of P and K were applied as an initial dose, while the remaining nitrogen was applied after the first irrigation.
Scanning Electron Microscopy (SEM) of Wheat Grain
First, the grain was longitudinally cut in the centre. Then, the endosperm was sliced to a 1 to 2 mm thickness. Subsequently, it was affixed with double-sided tape onto an aluminium electron microscope stub. The initial cut surface was gold sputter-coated to a thickness of 100. Å Photographic images were taken at 1.5KX at 20 kV, employing a ZEISS Supra ten VP field emission scanning electron microscope. (Carl Zeiss, Germany).
HMW-GS Protein Extraction and Identification
HMW-GS proteins were extracted, and SDS-PAGE electrophoresis was carried out following the method mentioned by49. The electrophoresis was conducted using a Hoefer SE600 system (Hoefer Pvt Ltd, USA). Allelic classification of HMW-GS loci for Glu-A1, Glu-B1 and Glu-D1 loci was done according to43.
Agronomical and Grain Characters
A thorough evaluation of agronomic traits was conducted in three replicates to assess the harvesting index (HI) parameter. HI was calculated as the ratio of grain to the total shoot dry matter, which indicated reproductive efficiency. The thousand-grain weight in g (TGW) and hectolitre weight in Kg/hl (HW) were determined as described in 19.
Flour Physiochemical Properties
Various physical properties of flour were thoroughly examined using specific methodologies tailored to each aspect. Whole-grain samples (35 to 40 g) were milled using a Cyclotec 1093 mill (Foss Tecator, Sweden). The flour obtained was used for physiochemical analysis. The particle size index (PSI) was determined as described in1. The AWRC test, which assessed flour hydration capacity under alkaline conditions, was conducted following the protocol outlined4. Micro sedimentation test (MST) and swelling index of glutenin (SIG) were reliable methods providing insights into gluten strength. They were performed using sodium lauryl sulphate and lactic acid, as described10,51. Flour protein content (FPC) analysis was determined using Duma’s total combustion method, proposed47, utilizing a CHNS-1000 elemental analyzer (Leco Inc, USA). The protein content was determined using the formula: Nitrogen content of flour * 5.82 (factor for wheat flour). All analyses of flour samples were carried out in triplicate, following the methodology outlined24.
Milling Properties and Flour Recovery
To examine flour recovery and biscuit-making properties, each cleaned wheat grain sample weighing 250 g was tempered by mixing it with water in a tightly closed container. After 16 hours, the moisture content of tempered wheat was adjusted to 15.6% by adding water1. This tempered sample was then milled in a laboratory flour mill (NAMAD s.n.c. Roma). Milling typically yields flour with varying particle fractions and fine and coarse particle proportions. One hundred grams of milled sample were sieved for 10 minutes using a laboratory sifter (AS 200 controls, Retsch, Germany). Sieve fraction samples were differentiated into three different milling fractions:>850µm bran, <850µm-250µm semolina, and <250µm maida (fine flour) and flour recovery were calculated.
RP-HPLC
RP-HPLC can separate gliadins or glutenin subunits according to molecular size and protein hydrophobicity. Compared to SDS-PAGE, RP-HPLC separation is extremely precise, fully automated, and highly reproducible for identifying and quantifying proteins28. Gliadin and glutenin samples were extracted using 50mg of wheat flour. Gliadin was extracted using the method given54. Extraction of glutenin is done according to the process by38. Gluten proteins were separatedusing an HPLC instrument (LC-2050 3D, Shimadzu. Japan) with a C8 column (Poroshell 300SB-C8). Glutenins were separated following the gradient RP-HPLC protocol described by 38. Gliadins were separated following the gradient RP-HPLC protocol described by28. Glutenins and gliadins were quantified by measuring the total area (maU) under the peak. The separated gliadin chromatograph was divided into three fractions (ω, α/β, γ), and the glutenin chromatograph was divided into HMW-GS and LMW-GS glutenins. The eluting solvents were water (100%) and acetonitrile (100%)containing 0.01% TFA. A running time of 16min was used (flow rate 1mL/min), and eluted protein was detected at 214 nm. Gliadin and glutenin sample injections were always 10µL.
Mixograph Properties
Dough mixing properties were studied using the 10g Mixograph. A mixograph is valuable for measuring and recording dough resistance during mixing. Following the1, 10 grams of flour on a 14% moisture basis were meticulously weighed and mixed at water absorption (62%). The mixing procedure utilized a 10g Mixograph (National Manufacturing Co., USA) connected to a computer, adhering1. The acquired data underwent analysis using Mixmart software (v. 3.4023), facilitating the recording of over 40 mixograph parameters. Various parameters were employed to characterize the height and width of curves at significant points in the mixing process. Only midline curve parameters were considered for this study. At the peak, parameters such as Mixograph Peak Value (MPV) and Mixograph Peak Width (MPW) were evaluated, representing the curve’s height and width, respectively. Similarly, at the end of the mixing process (8 minutes), Mixograph Value at 8 Minutes (MTV) and Mixograph Width at 8 Minutes (MTW) were assessed. Additional parameters included Mixograph Peak Time (MPTi) and Midline Curve integral for the first 8 minutes (MTxI). Dough weakening, a critical aspect, was quantified by calculating the difference between curve height values at peak time and 8 minutes of mixing. This derived parameter, the weakening slope (WS), was expressed as WS = MPV-MTV, following the methodology proposed by33.
Biscuit-making and Quality Testing
Two biscuits were prepared from each wheat flour sample following the AACC micro method biscuit protocol1. Biscuits were cooled at room temperature.Then, prepared biscuits were stacked flat, and the stack height was measured using a scale. The biscuits were restacked and measured again to determine the average thickness. For width measurement, biscuits were laid edge-to-edge.Additionally, the biscuitswere rotated by 90° and measured again to determine the biscuit diameter. The spread factor (SF) was calculated as the ratio of the average biscuit thickness to the average diameter.Biscuit hardness was assessed using a texture analyzer instrument (TA-XT2i, Stable Microsystem UK). A Snap test for biscuit cutting was conducted following the procedure outlined41.
Statistical Analysis
The collected data underwent an analysis of variance (ANOVA) test. When the results were significant (p≤0.05 and p≤0.01), the least significant difference (LSD) test was performed to detect any significant differences among the samples. The ANOVA and LSD analyses were conducted using the Agricolae R package9, and correlation analysis was performed using the corrplot R package 12 in RStudio software9.
Results
Grain Texture Ttudy
The grain SEM images of different wheat genotypes showed a clear-cut difference in starch and protein matrix interactions Figure1. HS 490 and NIAW3170 are soft wheat with a looser arrangement between starch and protein matrix; the starch body borders were smooth like river pebbles. Hard wheat genotypes MACS2496, MACS6478 and NI5439 showed the aggregation of compact protein and starch bodies, no clear separation of starch and protein bodies, and more interactions between these two entities. The SEM grain image of T. spherococcum also showed hard wheat-type, starch and protein matrix arrangements.
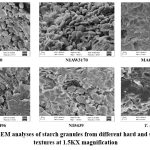 |
Figure 1: The SEM analyses of starch granules from different hard and soft wheat grain textures at 1.5KX magnification |
HMW-GS Identification
The HMW glutenin subunits were analysed for all six wheat genotypes and the standard Chinese spring Figure 2. At the Glu-A1 loci, three different alleles were detected; at Glu-B1, there were four alleles; at Glu-D1, only two were detected (Figure 2). The HMW-GS allelic distribution of these genotypes was tabulated in (Table 1). HS 490, NI5439 and T. spherococcum showed a null allele (Glu-A1c) at the Glu-A1 locus. While, genotypes, NIAW3170 and MACS6478, showed 2* (Glu-A1b) at Glu-A1 loci. MACS2496 showed the HMW-GS 1 (Glu-A1a) at Glu-A1. At Glu-B1 locus, genotypes NIAW3170, MACS6478, NI5439 showed 17+18 (Glu-B1i), HS 490 showed 7+8 (Glu-B1b) and MACS2496 showed 7+9 (Glu-B1c) HMW-GSs. T. spherococcum showed different HMW-GS at the Glu-B1 locus, which we named the Glu-B1ts allele (17+8). In this Glu-B1ts allele, the Glu-B1x band moves with similar mobility as HMW-GS Bx17, but the Glu-B1y moves faster than that of HMW-GS By18 and its mobility was similar to HMW-GSBy8.
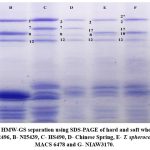 |
Figure 2: The HMW-GS separation using SDS-PAGE of hard and soft wheat genotypes. |
Table 1: HMW-GS score of soft and hard wheat phenotype.
|
Genotype |
Glu-A1 |
Glu-B1 |
Glu-D1 |
Reference |
|
Soft wheat |
||||
|
HS 490 |
Null (c) |
7+8(b) |
2+12(b) |
21 |
|
NIAW3170 |
2*(b) |
17+18(i) |
2+12(b) |
|
|
Hard wheat |
||||
|
MACS2496 |
1(a) |
7+9(c ) |
5+10(a) |
38 |
|
MACS6478 |
2*(b) |
17+18(i) |
2+12(b) |
20 |
|
NI5439 |
Null(c) |
17+18(i) |
2+12(b) |
20 |
|
T. spherococcum |
Null (c) |
17+8 |
2+12(b) |
– |
Agronomical and Grain Characters
Agronomical and grain characters were mentioned in Table 2. All the genotypes showed similar tillering habits. T. spherococcum showed the highest tillering. The tiller count per meter ranges between 89 and 103. Hectolitre weight showed ranges of 75 g -77 g; all the studied genotypes showed similar hectolitre weight, although the grain textural parameters differed. We do not observe a significant difference in hectoliter weight between hard and soft wheat. T. spherococcum showed a significantly lower harvest index value, while the other genotypes showed similar HI. The HI ranged from 0.32 to 0.48. Lower TGW was observed in T. spherococcum (23g), as the grains were small and spherical. NI5439, a rainfed bread wheat variety, also showed lower TGW (32g). MACS2496 also showed lower TGW, like NI5439, possibly due to the 1B/1R translocation. In contrast, the rest of the genotypes studied showed higher TGW.
Table 2: Agronomical, grain and physiochemical properties of soft and hard wheat.
|
Genotypes |
Tiller count/meter |
Hectolitre wt (g) |
HI |
TGW (g) |
|
Soft wheat |
||||
|
HS 490 |
99 a |
77 a |
0.42 a |
39 a |
|
NIAW3170 |
89 ab |
77 a |
0.44 a |
36 a |
|
Hard wheat |
||||
|
MACS2496 |
97 a |
77 a |
0.44 a |
34 a |
|
MACS6478 |
89 a |
78 a |
0.43 a |
34 a |
|
NI5439 |
90 a |
77 a |
0.46 a |
32b |
|
T. spherococcum |
103 a |
75 a |
0.34b |
23 c |
|
LSD (p<0.05) |
19 |
4 |
0.11 |
6 |
|
Mean |
95 |
77 |
0.42 |
33 |
|
Stdeva |
6 |
1 |
0.05 |
5 |
|
CV (%) |
6.2 |
1.1 |
12.2 |
16.5 |
|
LSD: p<0.05, Stdeva- Standard deviation, CV (%) – coefficient of variation. |
||||
Flour Physiochemical Properties
A total of five flour physiochemical properties were studied. Flour protein content ranged from 13% – 15%, and both, the soft wheat genotypes showed a lower flour protein content. Meanwhile, MACS2496 and NI5439 showed higher FPC (Table 3). Gluten strength was measured using the MST and SIG tests. MST ranges from 7cm-8cm, while SIG ranges from 4-5(Table 3). Soft wheat showed lower MST and SIG values, while hard wheat and T. spherococcum showed higher gluten strength (MST and SIG). AWRC ranges from 91%-122% (Table 3); soft wheat showed lower AWRC values than hard wheat. T. spherococcum also showed a higher AWRC value. The particle size index ranged from 21 to 29, and soft wheat (HS 490 and NIAW3170) showed higher PSI values than the rest of the studied genotypes (Table 3).
The study analyzed flour recovery from milling the grains and separated the output into bran, semolina, and flour (Table 3). All genotypes had similar bran content, ranging from 18% to 20%. However, soft wheat had significantly lower semolina content (17%) than hard wheat (24%-25%). Moreover, soft wheat showed higher flour recovery (64%) than hard wheat (56% to 58%). Ancient wheat T. spherococcum had significant differences in milling fractions compared to soft wheat, and they were observed to have hard wheat milling properties(Table 3).
Table 3: Agronomical and grain characters of soft and hard wheat flour.
|
Genotype |
MST (cm) |
SIG |
FPC (%) |
PSI (%) |
AWRC (%) |
Bran (%) |
Semolina (%) |
Flour(%) |
|
Soft wheat |
||||||||
|
HS 490 |
7.03 c |
3.82 c |
13 c |
27 a |
92 b |
18 a |
17 b |
64a |
|
NIAW3170 |
7.11 c |
4.00 c |
13c |
29 a |
91 b |
19 a |
17 b |
64 a |
|
Hard wheat |
||||||||
|
MACS2496 |
8.25 a |
4.90 a |
15 a |
23 b |
116 a |
19 a |
24 a |
57b |
|
MACS6478 |
7.52 ab |
4.36 ab |
14 ab |
21 b |
119 a |
18 a |
25 a |
58 b |
|
NI5439 |
8.05 a |
4.76 a |
15 a |
21 b |
122 a |
19 a |
25 a |
57 b |
|
T. spherococcum |
7.38 c |
5 a |
14 bc |
24 b |
113a |
20 a |
25 a |
56 b |
|
LSD (p<0.05) |
1 |
1 |
3 |
5 |
17 |
2 |
3 |
3 |
|
Mean |
8 |
4 |
14 |
24 |
109 |
19 |
22 |
59 |
|
Stdeva |
0.05 |
0.05 |
1 |
3 |
14 |
1 |
4 |
4 |
|
CV (%) |
6.5 |
9.7 |
5.6 |
11.8 |
12.4 |
3.6 |
17.4 |
6.6 |
|
LSD: p<0.05, Stdeva- Standard deviation, CV (%) – coefficient of variation. |
||||||||
Mixograph Properties
Dough mixing properties of wheat genotypes were tabulated in Table 4 and graphically represented in Figure 3. Soft wheat showed significantly lower values for all the studied mixograph traits except MTV. In mixograph midline peak parameters, MPTi ranges from 2min-4min, MPV ranges from 54%-64%, and MPW ranges from 19%–41%. Meanwhile, in a mixograph, midline tail parameters like MTV rangefrom 51% to 62%, MTW ranges from 11% to 32%, and MTxI (%) ranges from 344% to 524%. The dough-mixing properties of T. spherococcum do not significantly differ from hard wheat flour dough mixing properties (Table 3). We observed that soft wheat flour exhibits lower resistance to flour mixing in the mixograph.
Table 4: Mixing properties of soft and hard wheat flour.
|
Genotypes |
MLV (%) |
MLW (%) |
MPTi (Min) |
MPV (%) |
MPW (%) |
MRW (%) |
MRV (%) |
MTV (%) |
MTW (%) |
MTxI (%*Min) |
WS |
|
Soft wheat |
|||||||||||
|
HS 490 |
54c |
41b |
2c |
56c |
19c |
15c |
55 b |
55 ab |
12b |
344 b |
1.7c |
|
NIAW3170 |
52c |
41 b |
2c |
54c |
18 c |
15 c |
53 c |
51b |
11 b |
352 b |
1.5d |
|
Hard wheat |
|||||||||||
|
MACS2496 |
59 ab |
43 ab |
4 b |
63b |
45 a |
41 ab |
58 ab |
55 ab |
29 a |
460 a |
4.7 a |
|
MACS6478 |
61 a |
42 ab |
5 a |
67a |
46a |
43 a |
63 a |
62 a |
31 a |
502 a |
3.7 a |
|
NI5439 |
58 ab |
45 ab |
4 b |
63b |
45 a |
43 a |
57 b |
55 ab |
32 a |
524 a |
5.1 a |
|
T. spherococcum |
59 ab |
48 a |
3 cd |
64ab |
41 ab |
37bc |
60 a |
57 ab |
24a |
478 abc |
3.5 a |
|
LSD(p<0.05) |
4 |
7 |
1 |
4 |
8 |
6 |
5 |
8 |
9 |
71 |
2 |
|
Mean |
57 |
43 |
3 |
61 |
36 |
32 |
58 |
56 |
23 |
443 |
3 |
|
Stdeva |
3 |
3 |
1 |
5 |
14 |
14 |
4 |
3 |
10 |
77 |
2 |
|
CV (%) |
5.9 |
6.2 |
32.0 |
7.7 |
37.8 |
41.9 |
6.3 |
6.1 |
41.2 |
17.3 |
44.8 |
|
LSD: p<0.05, Stdeva- Standard deviation, CV (%) – coefficient of variation. |
|||||||||||
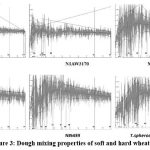 |
Figure 3: Dough mixing properties of soft and hard wheat flour. |
Gliadin and Glutenin Quantification using RP-HPLC
Gliadins and glutenins were separated and quantified using the RP-HPLC technique (Table 5 and Figure. 4). Soft wheat showed significantly higher omega, alpha/beta and gamma gliadins contents than hard wheat genotypes (Table 5). Soft and hard wheat showed similar HMW-GS and LMW-GS content. Except NIAW 3170 showed significantly lower LMW-GS content. Ancient wheat T. spherococcum also showed gliadin and glutenin contents as like hard wheat genotypes.
Table 5: Gliadin and glutenin quantification of soft and hard wheat flour using RP HPLC.
|
Genotype |
ω gliadin (maU*106) |
α+β gliadin (maU*106) |
γ gliadin (maU*106) |
LMW-GS (maU *105) |
HMW-GS (maU *105) |
|
Soft Wheat |
|||||
|
HS 490 |
18ab |
37 a |
45a |
20a |
7b |
|
NIAW3170 |
20a |
36a |
44 ab |
16b |
7b |
|
Hard wheat |
|||||
|
MACS2496 |
14b |
29b |
33c |
20a |
8a |
|
MACS6478 |
14b |
26 b |
34c |
20a |
7b |
|
NI5439 |
17ab |
24 b |
32c |
19a |
8a |
|
T. spherococcum |
16 ab |
28b |
30cd |
20a |
7b |
|
LSD (p<0.05) |
5 |
7 |
7 |
4 |
1 |
|
Mean |
17 |
17 |
36 |
19 |
7 |
|
Stdeva |
2 |
2 |
6 |
1 |
0.04 |
|
CV (%) |
13.8 |
13.8 |
17.6 |
7.3 |
3.1 |
|
LSD: p<0.05, Stdeva- Standard deviation, CV (%) – coefficient of variation. |
|||||
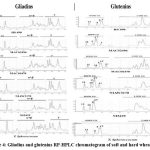 |
Figure 4: Gliadins and glutenins RP-HPLC chromatogram of soft and hard wheat flour. |
Wheat Biscuit Quality
Biscuits were baked from the flours of all the wheat genotypes studied. Four important biscuit quality parameters, such as height, diameter, spread factor and hardness, were recorded and tabulated (Table 6). Representative biscuits of all the genotypes were showed in Figure 5. Biscuit height ranges from 0.9cm to 1.2cm, biscuit diameter ranges from 7cm to 8cm, biscuit spread factor ranges from 6 to 9, and biscuit hardness ranges from 118N to 180N. Soft wheat flour produced biscuits with a significantly lower value for hardness and height than hard wheat genotype biscuits. We also observed higher values for biscuit diameter and spread factor in soft wheat flour biscuits than in hard wheat flour biscuits. Biscuits made from the T. Spherococcum showed inferior properties to hard wheat flour biscuits.
Table 6: Biscuit quality properties of soft and hard wheat flour
|
Genotypes |
Height (cm) |
Diameter (cm) |
Spread factor |
Hardness (N) |
|
Soft wheat |
||||
|
HS 490 |
0.9 b |
7.8 a |
9 a |
118 b |
|
NIAW3170 |
0.8 b |
7.6 a |
9a |
118 b |
|
Hard wheat |
||||
|
MACS2496 |
1.1a |
7.3 ab |
7b |
180a |
|
MACS6478 |
1.1a |
7.3 ab |
6c |
179 a |
|
NI5439 |
1.2a |
7.2 ab |
6c |
159a |
|
T. spherococcum |
1.1 a |
7.7 a |
7b |
162 a |
|
p<0.05 |
0.2 |
1 |
1 |
35 |
|
Mean |
1 |
7 |
7 |
153 |
|
Stdeva |
0.2 |
0.05 |
1 |
28 |
|
CV (%) |
15.2 |
3.7 |
19.5 |
18.4 |
|
LSD: p<0.05, Stdeva- Standard deviation, CV (%) – coefficient of variation. |
||||
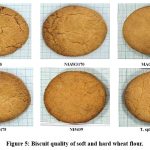 |
Figure 5: Biscuit quality of soft and hard wheat flour. |
Correlation Analysis
A higher biscuit spread factor is mainly associated with better biscuit-making quality. So, in correlation analysis, we correlated the biscuit spread factor with other studied parameters. Correlation analysis showed that spread factor had a significant negative association with biscuit hardness (r = -0.73), AWRC (r = -0.89), semolina content (r = -0.83), gluten strength parameters MST(r = -0.62), SIG (r = -0.64) and flour protein content (r = -0.51) Figure. 6a. However, the spread factor showed significantly positive associations with flour recovery (r = 0.80)) and PSI(r = 0.61) parameters. Most of the dough mixing parameters showed a strong negative correlation with the biscuit spread factor (Figure. 6b). The Gliadins fractionα+β (r = 0.77), ω(r = 0.51) and γ (r = 0.76) exhibited a strong positive correlation with the biscuit spread factor Figure 6B.
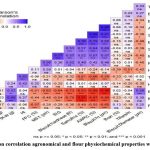 |
Figure 6A: Pearson correlation agronomical and flour physiochemical properties with biscuit quality |
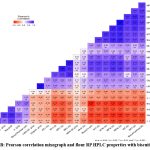 |
Figure 6B: Pearson correlation mixograph and flour RP HPLC properties with biscuit quality |
Discussion
Grain Texture
Wheat hardness is a crucial commercial trait for marketing and processing and varies between soft and hard wheat. The soft wheat SEM images show a weaker arrangement of starch and protein bodies and lesser starch damage, with smaller B granules (5μm to 9.9μm), while hard wheat has more A granules (10μm to 50μm)25. Grain hardness is governed by the hardness locus (Ha) . It is influenced by friabilin, a 15 kDa starch granule-bound protein. Soft wheat has more friabilin (primarily made up of two proteins (PINA and PINB) than hard wheat5,15. The knocking down of puroindolines (PINA and PINB) alters the grain texture55. In our findings, these factors may lead to weaker starch and protein matrix interaction in soft wheat than in hard wheat, which was also observed in this study. In the T. spherococcum genotype, no loose arrangement was observed between the starch and protein matrix. Based on our result, it can be inferred that T. spherococcum falls into the category of hard wheat.
HMW-GS and Quality Score
The expression of various quality characteristics in hard wheat and soft wheat was altered due to the diverse distribution of subunits at different Glu-1 loci, and this differential allelic combinations of HMW-GS alters the quality score46. A positive correlation between the damaged starch and Glu-1 score, which depends on HMW-GS23,43. HMW-GSs allele Glu-A1a (1), Glu-B1i (17+18) and Glu-D1d (5+10) have a higher impact on gluten quality, which may be used in bread making, while other HMW-GS alleles like Glu A1b(2*), GluB1b(7+8), GluB1c (7+9), GluD1d(2+12) show lower quality score for breadmaking. The alleles inferior for bread making may be superior for biscuit making. Currently, bread quality scoring is followed using the Glu-1 quality score, but this method is unsuitable for biscuits. In our present study, we observed soft wheat HS 490 contained Glu-B1b (7+8) and Glu-D1d (2+12), but in NIAW3170, this was not true, as it contains strong Glu-B1i (17+18), alleles at Glu-B1. We observed lower Glu-1 quality scores associated with alleles for Glu-D1 and Glu-A1 loci in studied hard wheat and T. spherococcum. This may be due to the suitability of this wheat for chapati making, which requires medium to lower gluten strength and hard texture grains. Generally the a lower Glu-1 quality score may be preferred for good biscuit-making46.
Agronomical Properties
A range of agronomic and physiological characteristics impacts the grain yield in wheat7; 30. Agronomic factors like harvest index (HI), the number of productive tillers, and higher TGW have significantly enhanced wheat grain yield. Similar to the results reported by46, no differences in TGW, and total yield were observed between hard and soft-grain wheat in this study. T. spherococcum ancient wheat has a smaller spherical grain size, resulting in lower TGW and hectolitre weight, similar to the research findings mentioned11,30. The T. spherococcum wheat exhibited a lower Harvest Index (HI) due to its lack of breeding for higher grain yield, resulting from the absence of selection pressure for grain yield advancement at that time.
Flour Physiochemical Properties
The functionality of wheat for specific enduse is closely linked to the protein content and composition of the grain48. Hard wheat, rich in protein (gluten), is ideal for bread and delicate cakes, whereas durum wheat flour is perfect for pasta like macaroni and spaghetti. Soft wheat, which is lower in protein and negatively influences gluten strength, is commonly used in biscuits, crackers, and breakfast foods31. MST and SIG are essential techniques for distinguishing wheat varieties based on qualitative and quantitative determination of gluten. In MST, the resulting sediment is associated with the swelling of glutenins, which is closely related to the breadmaking quality35. MST values and swelling gluten index indicate variations in gluten strength as higher gluten content leads to higher sedimentation volume17. Lower gluten strength is considered best for biscuit production as it minimizes the inhibition of biscuit spread during baking31. The AWRC is a test used to select flour with excellent biscuit quality. The flour fractions containing pentosans, proteins, glycoproteins, and damaged starch are believed to contribute to AWRC14. The AWRC is directly related to the increased damaged starch, which will also increase flour water absorption/holding capacity. High-quality biscuit-baking flours result in large biscuit diameters and low AWRC values14. We can also observe that soft wheat has a lower AWRC value and a looser starch and protein matrix (Figure.1).
PSI value acquired by grinding wheat samples sifting through a 0.075 mm sieve shows a notable correlation with flour yield. A high flour percentage passing through the sieve indicates grain softness. The critical quality criterion remains the enlargement of the biscuit diameter13. A desirable biscuit diameter is typically linked with soft-textured wheat with lower protein content. These wheat grains produce more break flour with finer particle sizes. We observed a higher fine flour fraction with a lower semolina faction in milling recovery. Refined flour obtained from soft wheat has a lower particle average size as described by45 .
The PSI and AWRC are important factors that determine the hardness of the grains. As shown in (Figure 1), soft wheat has a less compact adherence to starch and protein matrix than hard wheat. This results in lower AWRC and higher PSI levels for soft wheat. On the other hand, hard wheat has a more intricate protein and starch matrix structure, which leads to higher AWRC and lower PSI levels.
Mixing Properties
The mixograph offers insights into the rheological characteristics of dough, playing a vital role in assessing flour for a particular product51. There was a significant correlation between hardness and several mixograph parameters like MPV(%), MPW(%), MTV(%), and MTW(%)34. MPTi displayed a negative association with a more fluid gluten network due to higher gliadin content. The area under the midline curve MTxI was linked to grain hardness, rising alongside grain hardness and glutenin levels34. Mixograph curve shapes reflect the rheological and functional characteristics of the dough. Various mixograph curve heights offer insights into dough consistency, while curve width and weakening slope (WS) indicate mixing tolerance6,33. This study focuses on how these parameters affect biscuit quality and grain hardness. In soft wheat HS 490 and NIAW3170, we noted lower values for all examined mixograph parameters, which may negatively impact grain hardness. As mentioned earlier, grain hardness has a negative impact on biscuit quality.
Gliadin and Glutenin Content
Gliadins and glutenins comprise approximately 30% and 50% of the total endosperm proteins in wheat grain. In the context of the rheological properties of bread dough, it is theorized that gliadin contributes to extensibility, while glutenin contributes to viscoelasticity and strength29. The deletion of HMW glutenins negatively affected bread quality43. However, gliadin significantly correlates with wheat baking quality, such as biscuits and cakes 3,26,27 reported that incorporating gliadin fraction positively affects biscuit quality. This study also observed elevated gliadin levels in soft wheat compared to hard wheat.
Biscuit Quality
The biscuit quality mainly depends on the biscuit spread factor (SF)(SF = ratio of diameter/height), a parameter used to measure biscuit wheat quality. Biscuits from soft wheat have a higher biscuit spread factor and lower biscuit hardness than those made from hard wheat flour. This was found in a study by46and consistent with our findings. Dough prepared from soft wheat produced biscuits with higher porosity, resulting from larger pores, than dough prepared from hard wheat cultivars. Further more, biscuits prepared from hard wheat showed higher fracture stress than their soft wheat counterparts. Differences in porosity explain most of the variation in texture, but biscuit matrix strength also affects biscuit fracture stress 41.
T.spherococcum Biscuit Quality
The ancient T. spehrococcum wheat genotype exhibits several traits, similar to hard wheat and is not suitable for biscuit making.This wheat end-use quality has not been previously reported. Although it was an ancient cultivar, few domestication practices have been carried out. It has a lower harvesting index and is unsuitable for modern agronomic practices. However, it can be improved through traditional breeding for suitable end use.
Correlation with Spread Factor
In correlation analysis, it was found that there was a negative association between gluten strength46 (measured by MST and SIG) and good biscuit quality. Many studies have also reported that the AWRC (Alveograph W value) values are negatively associated with biscuit quality3. Lower flour protein content and strength are desirable for better wheat biscuit quality8. This has been observed in studies conducted on soft wheat genotypes such as HS 490 and NIAW3170. Flour protein contents and SDS sedimentation volume show a positive correlation with biscuit height and spread factor. On the other hand, grain hardness, damaged starch content and water SRC exhibit negative correlations with biscuit-specific volume13. Grain hardness is another complex trait that was negatively associated with biscuit quality.
Conclusion
In this study, we tested different wheat grain textures. The grain texture plays a crucial role in determining flour properties and the quality of end products. When selecting bread or biscuit-making genotypes, gluten strength, PSI, AWRC, flour protein, and mixing properties should be considered. Hard and soft wheat showed different milling fractions distribution that influenced biscuit quality. These test results suggested that soft wheat flour typically exhibits lower gluten strength with lower FPC and PSI. In contrast, hard wheat has a higher gluten strength, flour protein content, and lower PSI, flour recovery, resulting in more damaged starch and higher AWRC. The correlation analysis showed a negative correlation between gluten strength, AWRC, semolina, flour recovery, and flour protein content with the biscuit spread factor. Meanwhile, higher PSI, higher gliadin content and more flour recovery were positively associated with the biscuit spread factor. This study helps us to understand the role of starch and protein matrix association, which affects grain texture and wheat quality. These associations were strong in hard wheat and weak in soft wheat. The study concluded that simple and fast physiochemical tests such as PSI, MST, AWRC, and flour protein content would help to select the best biscuit-quality wheat. These tests are quick and simple, do not need high-end sophisticated instruments, and have high power to discriminate wheat genotypes for better biscuit quality. Ancient wheat showed all the parameters studied, such as hard wheat, and its inferior biscuit-making properties confirmed this.
Acknowledgement
The authors acknowledge the help of Dr Ajit Chavan in conducting field experiments. The CSIR New Delhi supports PM, and SK is supported by UGC, New Delhi, for doctoral fellowship.
Funding Sources
The author(s) received no financial support for the research, authorship, and/or publication of the article.
Conflict of Interest
The authors do not have any conflict of interest.
Data Availability Statement
This statement does not apply to this article.
Ethics Statement
This research did not involve human participants, animal, subjects, or any material that requires ethical approval.
Informed Consent Statement
This study did not involve human participants, and therefore, informed consent was not required.
Authors’ Contribution
Pravinkumar Methe: Collected data and wrote the manuscript.
Sonali Kawade: Performed data analysis.
Dr. Manoj Oak: Contributed to the experiment design and finalization of the manuscript discussion.
References
- AACC Approved Methods of Analysis, 11th Cereals & Grains Association, (1999).
- Abboud, A. M. G., Rubenthaler, G. L., & Hoseney, R. Carl. Effect of fat and sugar in sugar snap biscuit and evaluation of tests to measure cookie flour quality.CerealChemistry, 1985: 62, 124–129.
- Barak, S., Mudgil, D., & Singh Khatkar, B. Effect of composition of gluten proteins and dough rheological properties on the cookie‐making quality. British Food Journal, 2013:115, 564–574.
CrossRef - Bettge, A. D., Morris, C. F., DeMacon, V. L., & Kidwell, K. K. Adaptation of AACC Method 56-11, solvent retention capacity, for use as an early generation selection tool for cultivar development. Cereal Chemistry, 2002:79, 670–674.
CrossRef - Bettge, A. D., Morris, C. F., & Greenblatt, G. A. Assessing genotypic softness in single wheat kernels using starch granule-associated friabilin as a biochemical marker. Euphytica, 1995:86, 65–72.
CrossRef - Bordes, J., Branlard, G., Oury, F. X., Charmet, G., & Balfourier, F. Agronomic characteristics, grain quality and flour rheology of 372 bread wheats in a worldwide core collection. Journal of Cereal Science, 2008:48, 569–579.
CrossRef - Chen, X., Min, D., Yasir, T. A., & Hu, Y.G. Evaluation of 14 morphological, yield-related and physiological traits as indicators of drought tolerance in Chinese winter bread wheat revealed by analysis of the membership function value of drought tolerance (MFVD). Field Crops Research, (2012). 137:195–201.
CrossRef - De Santis, M. A., Giuliani, M. M., Flagella, Z., Reyneri, A., & Blandino, M. Impact of nitrogen fertilisation strategies on the protein content, gluten composition and rheological properties of wheat for biscuit production. Field Crops Research, 2020:254, 107829.
CrossRef - Dia, M., Wehner, T., and Arellano, C. RGxE: An R Program for Genotype x Environment Interaction Analysis. American Journal of Plant Sciences, 2017: 08, 1672–1698.
CrossRef - Dick, J. W., & Quick, J. S. A modified screening test for rapid estimation of gluten strength in early-generation durum wheat breeding lines. Cereal Chemistry Journal, 1983: 60, 315 – 318.
- Foulkes, M. J., Slafer, G. A., Davies, W. J., Berry, P. M., Sylvester-Bradley, R., Martre, P., Calderini, D. F., Griffiths, S., & Reynolds, M. P. Raising yield potential of wheat. III. Optimizing partitioning to grain while maintaining lodging resistance. Journal of Experimental Botany, 2011:62, 469–486.
CrossRef - Friendly, M.. Corrgrams. The American Statistician, 2002:56(4), 316–324.
CrossRef - Gaines, C. S. Associations among soft wheat flour particle size, protein content, chlorine response, kernel hardness, milling quality, white layer cake volume, and sugar-snap cookie spread. Cereal Chem., (1985). 62:290
- Gaines, C. S. (2000). Collaborative study of methods for solvent retention capacity profiles (AACC method 56-11). Cereal Foods World, 1998;45, 303–306.
- Greenwell, P. and S. J. D. A Starch Granule Protein Associated with Endosperm Softness in Wheat. Cereal Chemistry, 1986:63, 379-380.
- Grundas, S. T., & Wrigley, C. WHEAT | Ultrastructure of the Grain, Flour, and Dough. In Encyclopedia of Grain Science 2004: 391–400).
CrossRef - Guo, G., Lei, M., Wang, Y., Song, B., & Yang, J. Accumulation of As, Cd, and Pb in Sixteen Wheat Cultivars Grown in Contaminated Soils and Associated Health Risk Assessment. International Journal of Environmental Research and Public Health, 2018:15: 2601.
CrossRef - Hammer Karl and Knüpffer, H. (2015). Genetic Resources of Triticum. In S. and H. H. Ogihara Yasunari and Takumi , Advances in Wheat Genetics: From Genome to Field , 2015:2, 23–31).
CrossRef - Oak, M.D., Sissons, M.J., Egan, N., Tamhankar, S.A., Rao, V.S. and Bhosale, S.B. 2006. Relationship between gluten strength and pasta firmness in Indian durum wheats. International Journal of Food Science and Technology 41:538-544.
CrossRef - ICAR-IIWBR 2003. Progress Report of All India Coordinated Wheat & Barley Improvement Project 2013-14, Vol. IV, Wheat Quality. Eds: R.K. Gupta, D. Mohan, Sewa Ram, Sneh Narwal, O.P. Gupta and Indu Sharma. Directorate of Wheat Research, Karnal, India.2014,226-227.
- ICAR-IIWBR 2020. Progress Report of All India Coordinated Research Project on Wheat and Barley 2019-20, Wheat Quality. Eds: Sewa Ram, O.P. Gupta, Vanita Pandey and G.P Singh. ICAR-Indian Institute of Wheat and Barley Research, Karnal, Haryana, India. 2020,161-162.
- Katyal, M., Singh, N., Virdi, A. S., Kaur, A., Chopra, N., Ahlawat, A. K., & Singh, A. M. Extraordinarily soft, medium-hard and hard Indian wheat varieties: Composition, protein profile, dough and baking properties. Food Research International, 2017: 100: 306–317.
CrossRef - Kaur, A., Singh, N., Ahlawat, A. K., Kaur, S., Singh, A. M., Chauhan, H., & Singh, G. P. Diversity in grain, flour, dough and gluten properties amongst Indian wheat cultivars varying in high molecular weight subunits (HMW-GS). Food Research International, (2013). 53: 63–72. https://doi.org/10.1016/j.foodres.2013.03.009
CrossRef - Kraisid Tontisirin. Chapter 2: methods of food analysis . In Kraisid Tontisirin (Ed.), Food energy – methods of analysis and conversion factors 2003: 77, 7–17.
- Kumar, R., Kumar, A., Sharma, N. K., Kaur, N., Chunduri, V., Chawla, M., Sharma, S., Singh, K., & Garg, M. Soft and Hard Textured Wheat Differ in Starch Properties as Indicated by Trimodal Distribution, Morphology, Thermal and Crystalline Properties. PLOS ONE, 2016:11 (1). 1-14
CrossRef - KURAGANO, T. H. K. and Y. WADA. Effects of gliadin and glutenin on physical properties of biscuit.” Journal of Home Economics of Japan, 1991: 42: 45-52.
- Li, J., Li, J., Li, L., Xiang, L., Zhao, L., Liu, J., Liu, S., Yang, Q., Wu, J., & Chen, X. Effect of gliadin from Psathrostachys huashanica on dough rheological properties and biscuit quality. Food Chemistry, 2023:425, 136537.
CrossRef - Larroque, O.R. and Bekes, F. (2000), Rapid Size-Exclusion Chromatography Analysis of Molecular Size Distribution for Wheat Endosperm Protein. Cereal Chemistry, 77: 451-453. https://doi.org/10.1094/CCHEM.2000.77.4.451
CrossRef - Liu, X., Xu, W., Pan, Y., & Du, E. Liu et al. suspect that Zhu et al. (2015) may have underestimated dissolved organic nitrogen (N) but overestimated total particulate N in wet deposition in China. Science of The Total Environment, 2015:520, 300–301
CrossRef - Lopes, M. S., Reynolds, M. P., Jalal-Kamali, M. R., Moussa, M., Feltaous, Y., Tahir, I. S. A., Barma, N., Vargas, M., Mannes, Y., & Baum, M. The yield correlations of selectable physiological traits in a population of advanced spring wheat lines grown in warm and drought environments. Field Crops Research, 2012: 1(28), 129–136.
CrossRef - Ma, F., & Baik, B.-K. Soft wheat quality characteristics required for making baking powder biscuits. Journal of Cereal Science, 2018: 79, 127–133.
CrossRef - Marconi, E., & Carcea, M. Pasta from nontraditional raw materials. Cereal Foods World, 2001: 46, 522–530.
- Martinant, J. P., Nicolas, Y., Bouguennec, A., Popineau, Y., Saulnier, L., & Branlard, G. Relationships Between Mixograph Parameters and Indices of Wheat Grain Quality. Journal of Cereal Science, 1998:27(2), 179–189.
CrossRef - Mori, N., Ohta, S., Chiba, H., Takagi, T., Niimi, Y., Shinde, V., Kajale, M. D., & Osada, T. (Rediscovery of Indian dwarf wheat (Triticum aestivum L. ssp. sphaerococcum (Perc.) MK.), an ancient crop of the Indian subcontinent. Genetic Resources and Crop Evolution, 2013:60(6),1771–1775.
CrossRef - Morris, C. F. Puroindolines: the molecular genetic basis of wheat grain hardness. Plant Molecular Biology, 2002:48(5), 633–647.
CrossRef - Mutlu, A. C., Boyaci, I. H., Genis, H. E., Ozturk, R., Basaran-Akgul, N., Sanal, T., & Evlice, A. K. Prediction of wheat quality parameters using near-infrared spectroscopy and artificial neural networks. European Food Research and Technology, 2011. 233(2), 267–274.
CrossRef - Naeem, H. A., & Sapirstein, H. D. Ultra-fast separation of wheat glutenin subunits by reversed-phase HPLC using a superficially porous silica-based column. Journal of Cereal Science, (2007). 46(2), 157–168.
CrossRef - Oak, M.D., Tamhankar, S.A., Rao, V.S. et al. Relationship of HMW, LMW Glutenin Subunits and γ-gliadins with Gluten Strength in Indian Durum Wheats. J. Plant Biochem. Biotechnol. 2004. 13, 51–55
CrossRef - Ohm, J., Hareland, G., Simsek, S., & Seabourn, B. Size‐Exclusion HPLC of Protein Using a Narrow‐Bore Column for Evaluation of Breadmaking Quality of Hard Spring Wheat Flours. Cereal Chemistry, 2009:86(4), 463–469.
CrossRef - Panghal, A., Chhikara, N., & Khatkar, B. S. Effect of processing parameters and principal ingredients on quality of sugar snap biscuit: a response surface approach. Journal of Food Science and Technology, 2018:55(8), 3127–3134.
CrossRef - Pauly, A., Pareyt, B., Lambrecht, M. A., Fierens, E., & Delcour, J. A. Flour from wheat cultivars of varying hardness produces semi-sweet biscuits with varying textural and structural properties. LWT – Food Science and Technology, 2013:53(2), 452–457.
CrossRef - Payne, P. I., & Lawrence, G. J. Catalogue of alleles for the complex loci, Glu-A1, Glu-B 1 and Glu-D 1 which code for high-molecular-weight subunits of glutenin in hexaploid wheat. Cereal Research Communications,1983: 11, 25-29
- Payne, P. I., Nightingale, M. A., Krattiger, A. F., & Holt, L. M. The relationship between HMW glutenin subunit composition and the breadmaking quality of British‐grown wheat varieties. Journal of the Science of Food and Agriculture, 1987:40(1), 51–65.
CrossRef - Pearson, T., Wilson, J., Gwirtz, J., Maghirang, E., Dowell, F., McCluskey, P., & Bean, S. Relationship Between Single Wheat Kernel Particle‐Size Distribution and Perten SKCS 4100 Hardness Index. Cereal Chemistry, 2007:84(6), 567–575.
CrossRef - Report ID : 40355. Global Biscuit Market By Product Type (Bar Biscuit, Sandwich Biscuit, Molded Biscuit, Pressed Biscuit, and others), 2023: 1-347
CrossRef - Sharma, S., Katyal, M., Singh, N., Singh, A. M., & Ahlawat, A. K. Comparison of effect of using hard and soft wheat on the high molecular weight-glutenin subunits profile and the quality of produced cookie. Journal of Food Science and Technology, 2022:59(7), 2545–2561.
- Shea, F., & Watts, C. E. Dumas method for organic nitrogen. Industrial & Engineering Chemistry Analytical Edition, 1939:11(6), 333–334.
CrossRef - Shewry, P. R., Napier, J. A., & Tatham, A. S.. Seed storage proteins: structures and biosynthesis. The Plant Cell, 1995: 7(7), 945–956.
CrossRef - Singh, N. K., Shepherd, K. W., & Cornish, G. B. A simplified SDS—PAGE procedure for separating LMW subunits of glutenin. Journal of Cereal Science, 1991:14(3), 203–208.
CrossRef - Walker, C. E. and H. J. L. Rough rheological tests. Cereal Foods World, 1996: 41, 23 – 28.
CrossRef - Wang, C., & Kovacs, M. I. P. Swelling Index of Glutenin Test. I. Method and Comparison with Sedimentation, Gel‐Protein, and Insoluble Glutenin Tests. Cereal Chemistry, 2002: 79(2), 183–189.
- Wang, Y., Zhen, S., Luo, N., Han, C., Lu, X., Li, X., Xia, X., He, Z., & Yan, Y. Low molecular weight glutenin subunit gene Glu-B3h confers superior dough strength and breadmaking quality in wheat (Triticum aestivum L.). Scientific Reports, 2016:6(1), 27182.
CrossRef - Wrigley, C. W., Békés, F., & Bushuk, W. Chapter 1 Gluten: A Balance of Gliadin and Glutenin. In Gliadin and Glutenin: The Unique Balance of Wheat Quality. 2006: pp. 3–32.
CrossRef - Wieser H., Antes S., Seilmeier W. Quantitatively determining gluten protein types in wheat flour by reversed-phase HPLC. Cereal Chem.1998:5, 644–650.
CrossRef - Xia, L., Geng, H., Chen, X., He, Z., Lillemo, M., & Morris, C. F. Silencing of puroindoline alters the kernel texture in transgenic bread wheat. Journal of Cereal Science, 2008: 47, 331–338.
CrossRef