

Introduction
Background of the Study
Tomatoes are one of the world’s most important vegetables. It is a self-pollinated annual crop from the Solanaceae family with the same chromosomal number 2n=2x=241 2. A recent modification to the phylogenetic classification of the Solanaceae family resulted in the reintegration of the genus Lycopersicon into the genus Solanum, resulting in a new nomenclature2. Consequently, the clade Lycopersicon encompasses the genus Solanum lycopersicum L, which is domesticated together with its 12 closest wild relatives 1 2.
The fruit veggie tomato originated in Colombia, Bolivia, Chile, Peru, and Ecuador, all of which are part of the Andean area2 3. According to data collected from the previously stated places, tomatoes were initially planted in Mexico1. As a result, tomato was introduced to Europe shortly after the discovery of the New World and spread throughout the rest of the world3 4
The tomato is one of the world’s most important comestible and nutritious vegetable crops, second only to potatoes and sweet potatoes in terms of overall vegetable production. It is known to be produced in subtropical, tropical, and temperate climates, and hence ranks third in terms of vegetable output5 .China, the United States of America, India, Egypt, Turkey, Iran, Mexico, Brazil, and Indonesia are the top tomato-producing countries5. Tomatoes are commonly used in almost every household, therefore they have become an important component in public nutrition, and they are used in large numbers as compared to other vegetables to make sauces, soups, salads, stews, and other foods6.
The tomato is renowned for its flexibility in the kitchen. The fruit veggie is eaten when it is ripe and fresh, and it is used to make a wide range of processed meals, including paste, ketchup, powder, and whole fruits that are canned. Green, unripe tomato fruits are used to make pickles and preserves. Lycopene, a phytochemical found in tomatoes, protects cells against oxidative damage, which has been linked to cancer7
Tomatoes are extremely nutritious and include a high concentration of vitamins A and C as well as minerals8. They are also rich in sugar, essential amino acids, vitamins, minerals, and dietary fibres.
For its fruit, smallholder farmers, commercial state farmers, and private farmers in Ethiopia cultivate tomatoes, which are among the most important and widely grown vegetable crops during the rainy and dry season9 10 It has been noted that the nation produces roughly 81,738.05 tons of tomatoes annually on 7,255.93 hectares of land11. For optimal growth, tomato plants typically require warm temperatures and lots of sunshine.
Ethiopia’s climate and soil conditions support the growth of a broad range of fruits and vegetables, including tomatoes, which are primarily grown in the country’s eastern and central regions of the country’s medium- to low-lying regions.
While small-scale production for fresh market tomatoes often occurs in Koka, Ziway, Wondo-Genet, Guder, Bako, and many other regions, most of the tomato production happens in the upper Awash valley, in areas that are irrigated and receive rain12. This indicates that Ethiopia’s total tomato production has increased noticeably, and at the same time, it has emerged as the most profitable crop, bringing in more money for smallholder farmers than other produce
Market tomatoes are typically found in numerous locations, including Koka, Ziway, Wondo-Genet, Guder, and Bako. There has been a discernible rise in tomato output throughout Ethiopia. Simultaneously, this crop has emerged as the most profitable one, providing smallholder farmers with a greater income than other vegetable crops.12 However, in comparison to average yields of 51,41,36, and 34 Mt ha–1 in America, Europe, Asia, and the globe at large (FAO, 2010), Ethiopia’s tomato crop typically yields between 6.5 and 24 Mt ha–1 9.
Several tomato cultivars have been made available across Ethiopia and recommended for small-scale and commercial farming systems by the Melkassa Agricultural Research Center. Widely grown tomato cultivars include “Melka shola and Marglobe,” and verified cultivars Fetan, Bishola, EShete, and Matedel Some of the main obstacles to tomato production in Ethiopia include a lack of tomato varieties that are adaptable to a variety of agro-ecologies, inadequate irrigation systems, a lack of data on soil fertility, poor quality seeds, disease and insect pests, a high post-harvest loss rate, a lack of awareness of current enhanced technology, and inadequate advertising campaigns
Due to the wide range of intrinsic and dynamic soil qualities found in Ethiopia, different agro-ecologies within the nation have different fertilizer recommendations based on preliminary research. A number of factors, including soil type, moisture content, fertility status, climate, crop varieties, crop rotation, and crop management techniques, affect how much fertilizer is economically possible. One of the issues preventing Ethiopia from producing as much food as it could of Solanaceae crops, such as tomatoes and potatoes, is low soil fertility13
The majority of growers rely on P in the form of diammonium phosphate (DAP) and N in the form of urea because most soils in western South Ethiopia are deficient in macronutrients and micronutrients due to the frequent and long-year cultivation of staple crops14. In substitute of DAP, the Ministry of Agriculture has just launched a new brand of blended NPS fertilizer for farmers to utilize. It contains 18.7% N, 37.7% P2O5, and 6.95% S. While a balanced supply of N, P, and S has a cumulatively beneficial effect on crop growth because N enhanced vegetative growth and accelerated photosynthesis, application of 80, 160, and 240 kg ha-1 NPS significantly increased tomato growth, yield, and yield components at lower rates. Local farmers did not apply mixed fertilizer (NPS) in Jimma conditions in order to boost tomato yields.
The determinate varieties Bishola, Chali, Cochoro, Fetan, Melka shola and Melkasalsa, plus the semi-determinate varieties Metadel and Miya were examined for tomato yield components and seed yield under Jimma conditions15. Even though these tomato varieties were assessed for component and seed yield in Jimma conditions, there is a lack of information on nutrients in soil fertility and a scarcity of tomato seeds that the research site recommends the local community use to encourage tomato production in Jimma conditions.
It limits the creation of tomato cultivars as well. The two tomato processing varieties, Melka shola and Gelelma, in combination with mixed (NPS) fertilizer haven’t been studied in Jimma circumstances, though. In order to investigate the impact of mixed fertilizer rates (NPS) on the growth, yield, and yield components of tomato varieties in Jimma, this research was started.
Objective of the Study
General Objective
To assess the effects of blended fertilizer rates and varieties (NPS) on tomato growth, yield and yield components under Jimma conditions.
Determintion of the optimum level of blended fertilizer (NPS) rates on tomato growth, yield, and yield components under Jimma conditions
To identify the best varieties on the growth, yield, and yield components of tomato under Jimma conditions.
To evaluate the interaction effect of blended fertilizer rates and varieties (NPS) on growth, yield, and yield components of tomato under Jimma conditions.
Materials and Methods
Description of the Study Area
At the Jimma University College of Agriculture and Veterinary Medicine study site, the experiment was carried out using irrigation from November 23, 2019, to March 2020, during the dry season. In the southwest of Ethiopia, in the Oromia Regional State, Jimma is located 356 kilometers away from Addis Ababa. It is located in a zone of mid-altitude subhumidity. Situated at latitude 7o 42′ N and longitude 360° 50′ E, the location is 1710 meters above sea level. At the study site, the pH of the clay loam soil textural classes was 5.27, indicating a slightly acidic nature16. The average yearly rainfall in the area is 1250 mm, with highest and lowest temperatures of 26.2 and 11.3°C, respectively. The average maximum and minimum relative humidity at the site are 91.40 and 37.92%, respectively17
Experimental Material
Two types of tomato varieties were collected from the Melkassa Agricultural Research Center as experimental material.
Table 1: Decription of two tomato varieties used for the experiment
|
Varieties |
Altitude |
Growth habit |
Unique character |
Utilization |
Maturity days |
|
Melka shola |
700-2000 |
Determinate |
Globular fruit shape |
Processing |
100-120 |
|
Gelelma |
700-2000 |
Determinate |
Large fruit size, oval fruit shape |
Processing |
100-120 |
Source: Regassa et al., 2012 and MARC
Experimental design and treatments
With ten treatments and three replications, the study was set up as a 2×5 factorial with a full randomized block design (RCBD). Two tomato varieties (Melka shola and Gelelma) and five rates of mixed (NPS) fertilizer (0 kg ha, -1 50 kg ha, -1 100 kg ha, -1 150 kg ha-1, and 200 kg ha-1) were used as treatments.
Table 2: Treatment combination and their description of the experiment
|
Trt |
Varieties |
Blended (NPS) fertilizer |
Description |
|
1 |
Melka shola (V-1) |
0 kg ha-1 |
0 Kg (NPS) blended fertilizer + Melka shola |
|
2 |
Melka shola (V-1) |
50 kg ha-1 |
50 Kg (NPS) blended fertilizer + Melka shola |
|
3 |
Melka shola (V-1) |
100 kg ha-1 |
100 kg (NPS) blended fertilizer + Melka shola |
|
4 |
Melka shola (V-1) |
150 kg ha-1 |
150 kg (NPS) blended fertilizer + Melka shola |
|
5 |
Melka shola (V-1) |
200 kg ha-1 |
200 kg (NPS) blended fertilizer + Melka shola |
|
6 |
Gelelma (V-2) |
0 kg ha-1 |
0 kg (NPS) blended fertilizer + Gelelma |
|
7 |
Gelelma (V-2) |
50 kg ha-1 |
50 kg (NPS) blended fertilizer + Gelelma |
|
8 |
Gelelma (V-2) |
100 kg ha-1 |
100 kg (NPS) blended fertilizer + Gelelma |
|
9 |
Gelelma (V-2) |
150 kg ha-1 |
150 kg (NPS) blended fertilizer + Gelelma |
|
10 |
Gelelma (V-2) |
200 kg ha-1 |
200 kg (NPS) blended fertilizer + Gelelma |
Experimental Procedures
At the location chosen for the previously described test, twelve trays containing seeds of two distinct tomato varieties were planted on November 23, 2019. The greenhouse was used for this purpose. The trial field was twice tilled by a tractor to break up a large clod and generate fine soil before the seedlings were transplanted. The trial was set up and leveled using a peg, rope, and hand tool. The intended dimensions were 3 m x 3 m (9 m2) in order to accommodate four rows. Ten plants per row were included in each plot, with rows spaced 70 cm by 30 cm apart.
This method of maintaining plants was used for every plot. The total number of plants inside a plot remained at forty in the trial size of thirty plots. There were 0.5 and 1 meters between plots and blocks, respectively. The total area of land used was 12 m x 35 m (420 m2), with a net plot size of 1.5 m x 2.7 m (4.05 m2). To collect data, ten plants were chosen at random.
The total number of plants inside a plot remained at forty in the trial size of thirty plots. There were 0.5 and 1 meters between plots and blocks, respectively.
The total area of land used was 12 m x 35 m (420 m2), with a net plot size of 1.5 m x 2.7 m (4.05 m2). To collect data, ten plants were chosen at random.
The plants were irrigated twice a day, in the early morning and late afternoon, for the first to fourth week following the seedlings’ stabilization. After that, until the plants eventually reached the maturity stage and were harvested, once a day in the late afternoon when they were stable and well-established. The entire experiment depended on the local weather and soil moisture content after that, with each plot receiving an equal amount of water.
For mixed fertilizer (NPS), a comprehensive approval of 100 kg of DAP per acre was taken into consideration as the baseline. 18.9% N, 37.7% P2O5, and 6.95% S make up the fertilizing configuration of the blended fertilizer (NPS). Prior to fertilization, the total number of blended fertilizers (NPS) was determined and divided into two equal portions. The trial plants received the first half of the mixture as a baseline application one week after transplantation, and the second half was applied when the plants began to flower.
This was done to avoid withering and overgrowth of the vegetative tissues, which could be the biggest factor reducing the yield of tomato fruits. The tomato plant was physically fortified during the growing season with a two-meter-tall stick, and it was made to stand erect with thin metal wire and rope. When the plant began to flower, this was done, and it was done again until the last harvest. Utilizing a hand tool and hand weeding was the most efficient method of controlling weeds. It was carried out every fifteen days, and corrective action was taken as soon as the plants displayed symptoms of disease or insect pests.
Chemical treatment was the last choice; guidelines called for the use of mancozeb, karate, and lime powder for the control of illness and pests. All agronomic practices were carried out in the experimental field in compliance with the guidelines provided for the crop in each plot.
When the tomato fruits reached the green mature stage and some turned light yellow, they were hand-picked to prevent the fruits’ metabolism from changing and leading to weight loss. To demonstrate their determinateness, two tomato varieties were harvested once. The two middle rows from which the data originated were marked with different colored ropes prior to data collection.
Soil Sampling and Aalysis
An auger was used to distribute blended (NPS) in a zigzag pattern to the experimental field after a composite soil sample was taken at a depth of 0–30 cm. After mixing the collected soil samples, a representative sample weighing one kilogram was made for chemical analysis (pH, CEC, OC, TN, and existing phosphorus) as well as physical examination (soil texture) (AP). The material was allowed to air dry before being broken down and sieved through a 2 mm sieve to check for the six characteristics mentioned above. The standard laboratory procedures listed below were used to evaluate all samples 16 18
The particle size distribution was examined using the Bouyoucous hydrometer method. Organic materials (OM) were burned using hydrogen peroxide (H2O2). The soil particles were broken down using sodium carbonate (Na2CO3) and sodium hexametaphosphate (NaPO3) in distilled water. Amyl alcohol was utilized to remove the foam present in the soil solution. The concentration of organic matter (OM) in the soil can be calculated by multiplying the percentage of organic carbon (OC) by 1.724, leading to the hypothesis that OM contains 58% carbon.
A sample of two grams of soil was weighed and put into a flask. The dirt was mixed thoroughly with 20 milliliters of concentrated sulfuric acid (H2SO4) and 10 milliliters of 0.167 potassium dichromate, and the mixture was allowed to stand on the cork pad for 30 minutes. To chill the mixture, add 10 ml of concentrated orthophosphoric acid and 200 ml of distilled water19.
Total nitrogen (TN) was measured using Kjeldahl digestion, and then the oxidization of OM in a 0.1N H2SO4 solution of sulfuric acid was utilized for distillation and titration . In a Kjeldahl flask, 5 g of soil sample and 30 ml of sulfuric acid were mixed together. After that, the mixture was heated and rapidly brought to a boil until it became clear, at which point it was allowed to continue to be digested for at least half an hour20.
In order to measure the cation exchange capacity (CEC), a 5 grams sample of soil was placed in a 50 ml centrifuge tube and mechanically shook for 5 minutes. To this solution, 25 ml of 10.0M sodium acetate solution was added. To find the amount of salts exchangeable, 1N ammoniumacetate (NH4OAc) was used to saturate the soil and then 1N NaOAc was added to replace it.21
The pH of water at a soil-to-water ratio of 1:2.5 was measured using potentiometric pH meters with glass electrodes16. 10.0g of soil sample were suspended in water in a 500 ml beaker. Following that, 10 milliliters of distilled water were added to the suspension in a 1:2.5 soil to water ratio, and the suspension was automatically stirred for 30 minutes. Next, a pH meter that had been calibrated was used to measure the pH.
The Olsen procedures were utilized to determine the available phosphorus concentration of the soil using sodium bicarbonate (0.5M NaHCO3) as an extraction solution22. A dry, spotless plastic bottle held five grams of dirt. After adding the extraction solution, the mixture was let to sit for six hours, or until the supernatant separated, while being agitated for around two minutes. The process was then repeated until the blue color intensified; this color was intended to represent the quantity of phosphorus present in the soil.
The soil at the experimental site had a pH of 5.27, which is somewhat acidic, according to the findings of the soil study. The availability of phosphorus (7.436 ppm), total nitrogen (0.108%), and organic carbon (1.235%) was low in the soil. The soil texture at the research site is composed of silt, clay, and sand with corresponding contents of 23%, 45%, and 15.75 cmol. The soil textural classifications are clay loam, based on soil rating indices from the soil laboratory, as shown in (Table 2)16.
Table 3: Physico-chemical properties of soil samples and analysis from the experimental site
|
S/No. |
Parameter |
Availability |
Unit |
Rating |
References |
|
1 |
Soil texture |
Kamara et al.,1992 |
|||
|
Sand |
32 |
% |
|||
|
Clay |
23 |
% |
|||
|
Silt |
45 |
% |
|||
|
Textural classes |
Clay loam |
Clay loam |
Mulugeta et al., 2016 |
||
|
2 |
PH |
5.27 |
mV/L |
Moderately acid |
|
|
3 |
OC |
1.235 |
% |
Low |
Dewan and Amasu,1987 |
|
4 |
TN |
0.108 |
% |
Low |
|
|
5 |
AP |
7.436 |
Ppm |
Low |
Eshetu, 2018 |
|
6 |
CEC |
15.75 |
Cmol |
Medium |
Yerima et al., 1990 |
Where, pH = hydrogen power, OC = organic carbon, TN = total nitrogen, Av.P= available phosphorus, CEC = cation exchange capacity
Data Collection
Ten plants were randomly chosen from each of the two center rows on each plot and tagged for data collection, in addition to the single external row on either side of the plot and the one plant at each end of the two middle rows that were designated as border plants. Samples were arranged on both sides of the plot in an internal row.
Growth Parameters
Plant height (cm): A week after the previous harvest, ten randomly chosen plants from each plot’s two center rows were measured for height using a centimeter. The mean values of these measurements were then calculated.23
Number of primary branches per plant: Within one week of the final harvest, ten randomly selected plants from each plot’s central two rows were counted. The mean values were then computed23.
Number of leaves per plant: Within a week of the final harvest, ten randomly selected plants from each plot’s two middle rows were counted, and the mean values were computed24.
Days to 50% flowering: Days were counted from the time of transplantation until half of the plants in the central rows of a plot flowered days were counted from the time of transplantation until half of the plants in the central rows of a plot flowered25.
Days to First Fruiting
Keep track of the number of days that passed after each plot’s center rows were transplanted until the first plants produced fruit16.
Days to 50% fruit maturity Days were measured from transplantation until half of the plants in a plot’s center rows flowered.25
Yield and Yield Component Parameter
Number of Flowers Per Custer
Ten plants were chosen at random from the two central rows, and sixteen flower clusters were marked with rope of various colors. A mean was computed by counting the number of blooms in each cluster.26
Number of Fruits Per Cluster
This was determined by counting the fruits from the flower cluster that had been tagged, and their mean was also determined.23
Fruit set percentage: This was calculated according to the formula below (Lidia, 2014).
Number of Fruit Clusters Per Plant
Two days before to the final harvesting, ten plants were selected at random from two center rows, and each plant’s total number of fruit clusters was tallied23.
Fruit Length (cm)
A centimeter was used to measure the length of ten randomly selected fruits from each plot, and the resulting mean was computed.27
Fruit WSidth (cm)
Ten fruits that were selected based on their length had their width measured in centimeters as well, and their mean was computed.28
Marketable Fruit Yeld Per Hectare (t/ha)
The fruits were collected one by one from ten of the plants in the middle two rows. Fruits that were and weren’t marketable were combined. When the fruit yield weight was converted to hectares, marketable fruit was defined as those that did not show any overt signs, such as undersize, physiological abnormalities, pest or insect damage, or any other visible indications. Next, fruit that was marketable and unmarketable was categorized using.29
Marketable Fuit Nmber PerPlot
Following harvests, the amount of marketable fruits from each plot was counted and recorded.30
Marketable Fruit Weight by Size Group (g)
The marketable fruits were divided into three categories: medium/standard (60-70g), small (59-31g), and large (>71g). The weight classes are chosen based on a standard fruit weight of 60–70. Fruit weights above and below this standard were classified as large and small, respectively26 31 32.
Unmarketable Fruit Yield Per Hectare (t/ha)
Fruits undersized (less than 30 g) and damaged by pests or insects were weighed, counted, and their weight translated to hectares26 33
Unmarketable Fruit Number Per Plot
During the course of the two rows’ subsequent harvests, the quantity of unmarketable fruits was gathered, tallied, and recorded for each plot in the center 30
Number of Total Fruit Yields Per Plant
The total fruit yield per plant was calculated by adding the marketable and unmarketable fruit output from successive harvests and dividing by the number of plants collected15.
Total Fruit Yield Per Hectare (t/ha)
This was calculated by summing marketable and unmarketable fruit yields. This yield was acquired from the two central rows, which were gathered and classified as marketable and unmarketable yields using the above-mentioned specifications. The two yields were then combined and weighed to determine the total yield 23 25 26 31.
Data Analysis
The collected data was provided for analysis of variance (ANOVA) using SAS version 9.3 computer software. When ANOVA revealed a significant difference, mean separation was carried out using the least significant difference (LSD) test at the 5% significance level34. The correlation analysis was used to create data in order to predict the relationship between growth, yield, and yield component factors.
Partial Budged Analysis
Partial budget analysis was used to create economic return analysis13 35. The cost of mixed fertilizer (NPS) in the experimental field as well as the tomato variety sales prices after harvest were taken into account when calculating the net return (Birr ha-1). To display the maximum and lowest return, the net benefit was divided by the total cost of fertilizer to determine the marginal rate of return (MRR%)16. In order to determine the highest and lowest net benefit, the economic return estimate was calculated by comparing the actual income received following tomato harvest with the cost of the blended fertilizer rate (NPS) on the total fruit yield per hectare (kg ha1)35.
Results and Dicussion
Growth parameters
Plant Height (cm)
On the number of primary branches per plant, the tomato cultivars and mixed fertilizer (NPS) both showed a significant influence (p = 0.001 and 0.0001, respectively). Nevertheless, Appendix Table 1’s interaction effect showed nonsignificant values (p = 0.056). The mixed fertilizer rate at 200 kg ha-1 and 150 kg ha-1 resulted in the largest number of primary branches per plant (11.8 and 11.2). As indicated in (Table 4), the least number of primary branches per plant (9.18) was seen at control (0 kg ha-1). The number of major branches per plant increased when mixed fertilizer rates (NPS) were applied at their optimal rate.
Table 4 shows that Melka shola had the highest number of primary branches per plant (11.6) while Gelelma had the lowest number of primary branches per plant (9.6).
The results of Khan37, who reported that the maximum number of primary branches per plant ranged from 14.21 to 17.98 and that the number of primary branches per plant increased with an increase in nitrogen fertilizer application rate from 0 kg ha-1 to 150 kg ha-1 N, are consistent with the findings of this study.
Number of Leaves Per Plant
In terms of the number of leaves per plant, the characteristics of blended fertilizer and tomato varietals (NPS) were shown to be significant (p = 0.0352 and p = 0.0178), but their interaction impact showed no significance (p = 0.99) (Appendix Table1). The application of a blended fertilizer rate at 150 kg ha-1 produced the highest number of leaves per plant (82), which was followed by 200 kg ha-1, 100 kg ha-1, and 50 kg ha-1. These values were not statistically different from the other values and were found to be similar in the column. The lowest number of leaves per plant was observed in the control (0 kg ha-1).
The largest amount of leaves per plant was produced when a greater blended fertilizer (NPS) rate was applied. This increased plant elongation, plant height, and the number of primary branches per plant were all much enhanced. Compared to Gelelma, Melka shola had the most leaves per plant (80.113) (Table 4). This could be attributed to the difference varietal and genetic makeup of Melka shola, which produced much more leaves than Gelelma.
The results of this study were found to be consistent with those of Ogundare24, who examined growth and fruit yield and reported the maximum number of leaves per plant after treatment of 125 kg ha-1 NPK + 3 t ha-1 poultry manure. This experiment’s significance showed that fertilizer treatment had an impact on the increase in the number of leaves per plant.
Days to 50% Flowering
The number of days to 50% blooming was significantly impacted (p = 0.0003 and p = 0.0205) by the effects of both tomato types and mixed fertilizer (NPS). Appendix Table 1 shows that their interaction impact was not determined to be significant (p = 0.4167). The application of a blended fertilizer rate at 200 kg ha-1, followed by 150 kg ha, resulted in the longest days to 50% flowering (44.6 days), whereas the control (0 kg ha-1) had the lowest days to 50% flowering (35.3 days).-1 Applying the highest blended fertilizer rates (NPS) may significantly affect how many days it takes to flower 50% of the time.
because of the available nutrients that the tomato plant took from the soil, but the control plot’s tomato plants had the quickest days to 50% flowering because of the low amount of nutrients in the soil that they absorbed. According to (Table 4), Gelelma had the shortest days to 50% blooming (38.5 days) and Melka shola had the longest days to 50% flowering (41.1 days). This could be because Gelelma has a genetic trait that causes it to flower 50% faster than Melka shola.
The results of this study are found to be consistent with those of Lidia26 who discovered that the control plot had the shortest days to 50% flowering and the greater nitrogen fertilizer application level had the longest days to 50% flowering. This study also agrees with the results of Meseret25, who reported that the time between transplanting and flowering on tomato varieties’ days to 50% flowering ranged between 38 and 49 days. Gebisa23 also found this to be true, reporting that the time between transplanting and flowering on tomato varieties’ days to 50% flowering lies between 36 and 42 days.
This result was found to be at odds with the results of Aminifard36, who reported the maximum days to 50% flowering on plot without nitrogen fertilizer, as well as with the findings of Naem (2002) and Mehmood44, who reported the early days to 50% flowering on plot with low amount of nitrogen fertilizer rate.
Days to First Fruiting
Days to first fruiting were significantly impacted by the blended fertilizer and tomato variety (NPS) (p = 0.0001 and 0.026), but not significantly by their interaction (p = 0.585) (Appendix Table 1). The blended fertilizer rate at 200 kg ha-1 produced the longest days to first fruiting (48 days), while the remaining blended fertilizer rates (NPS) displayed similar latter in the column as indicated in (Table 4). The shortest days to first fruiting (37 days) were recorded from the control (0 kg ha-1).
Applying 200 kg ha-1 of mixed fertilizer (NPS) instead of the recommended 0 kg ha-1 could cause days to pass before the first fruiting and delay flowering by up to 50%. According to Table 4, Melka shola had the fewest days to first fruiting (40.7 days) compared to Gelelma, which had the longest (43.2 days). This might be because Melka shola has a different genetic makeup than Gelelma, which results in a shorter time span between flowering and first fruiting.
This study was found to be in line with the findings of Lidia26, who reported that the maximum days to first fruiting from application of higher nitrogen level (138 kg ha-1) and minimum days to first fruiting from the control (0 kg ha-1). Mehmood37 found that increasing nitrogen level can delay days to first fruiting. This study supports the findings of Ketema12, who investigated nine different tomato cultivars and found that the time between transplantation and the number of days before first fruiting varied from 31 to 37.
Days to 50% Fruit Maturity
On the days to 50% fruit maturity, the impacts of mixed fertilizer (NPS) and tomato types were significant (p = 0.0001 and p = 0.0393), while their interaction effect was not significant (p = 0.1162) (Appendix Table1). The application of a mixed (NPS) fertilizer rate at 200 kg ha resulted in the longest days to 50% fruit maturity (76 days), whereas the control (0 kg ha-1) had the shortest days to 50% fruit maturity (67.1 days).-1 As indicated in (Table 4), the remaining blended fertilizer rates (NPS) showed the same latter.
The longer the days to 50% fruit maturity, the higher the mixed fertilizer (NPS) application; this is because the soil continues to give accessible nutrients; on the other hand, the shorter the days to 50% fruit maturity, the lower the soil’s availability of nutrients. In comparison to Gelelma, which shown the greatest days to 50% fruit maturity (72.9 days), Melka shola displayed the shortest days to 50% fruit maturity (71.06 days). This might be due to the varietal differences between the two tomatoes in Table 4. Fertilizer applications of varying intensities may result in blossom end rot, which can cause tomato fruits to fall before they reach a typical size and prolong the time until 50% of the fruit reaches maturity (Figure 6).
These results are consistent with those of Hamptom38 who discovered that tomato fruit can develop blossom end rot due to either a high or low nitrogen treatment rate. Similar results were obtained, which are consistent with those of Lidia26 who reported the maximum number of days to 50% fruit maturity at the application of the highest nitrogen level, 138 kg ha-1, and the early days to 50% fruit maturity at control 0 kg ha-1 N.
Table 4: The effects of the blended (NPS) fertilizer on the growth parameters of tomato varieties.
|
Treatment |
Growth parameter |
||||||||
|
Blended (NPS) fertilizer (kg ha-1) |
PH (cm) |
NPB/Pt |
NL/Pt |
D50% FL |
DFF |
D50% FM |
|||
|
0 |
50.8c |
9.18c |
62.9b |
35.3c |
37c |
67.1c |
|||
|
50 |
53.3bc |
10.4b |
73.5ab |
38.16bc |
40.6b |
71.1b |
|||
|
100 |
57.5ab |
10.5b |
80.08a |
39.5b |
41.3b |
72.3b |
|||
|
150 |
55.9ab |
11.2ab |
82.08a |
41.5ab |
42.8b |
73b |
|||
|
200 |
59.9a |
11.8a |
77.4a |
44.6a |
48a |
76a |
|||
|
LSD (at 5%) |
4.5 |
1.07 |
12.4 |
3.3 |
3.3 |
2.7 |
|||
|
Tomato varieties |
|||||||||
|
Melka shola 1 |
57.48a |
11.6a |
80.113a |
41.1a |
40.7b |
71.06b |
|||
|
Gelelma 2 |
53.57b |
9.6b |
70.3b |
38.5b |
43.2a |
72.9a |
|||
|
CV (%) |
6.7 |
8.3 |
13.6 |
7 |
6.6 |
3.1 |
|||
|
LSD (at 5%) |
2.8 |
0.6 |
7.8 |
2.1 |
2.1 |
1.7 |
|||
Mean values that share the same latter (s) are not significantly different at p<0.05. CV (%) = Coefficient of variation, LSD (0.05) = least significant difference, while PH = plant height, NPB/Pt = Number of primary branches per plant, NL/Pt =Number of leaves per plant, D50% FL = Days to 50% flowering, DFF = Days to first fruiting, and D50% FM = Days to 50% fruit maturity.
Yield Components
Fruit Set Percentage
The exchange The percentage of tomatoes in the fruit set was significantly impacted (p = 0.0001) by the combination of tomato cultivars and fertilizer (Appendix Table 2). The highest percentage of fruit sets (94.2 and 91.5%) was observed when both the Gelelma and Melka shola varieties were combined with a blended fertilizer rate of 150 kg ha-1. Conversely, the lowest percentage of fruit sets (58.6 and 59.03%) was noted when the control (0 kg ha-1) was combined with both the Gelelma and Melka shola varieties.
In order to maximize production and have a major impact on fruit set percentage, the application rate of blended fertilizers (NPS) was increased from 0 kg ha-1 to 150 kg ha-1. This resulted in an increase in plant height, the number of primary branches per plant, and the number of leaves per plant (Table 5). The results of Lidia26 who concluded that a high nitrogen fertilizer treatment rate only enhanced floral development without fruit setting, are not supported by this investigation.
Table 5: Interaction The effects of the blended fertilizer and tomato varieties on fruit set percentage
|
Fruit set percentage |
|||||
|
Treatment |
Blended (NPS) fertilizer (kg ha-1 ) |
||||
|
Tomato varieties |
0 |
50 |
100 |
150 |
200 |
|
Melka shola 1 |
59.03g |
68.1f |
78e |
94.2a |
88.7bc |
|
Gelelma 2 |
58.6g |
76.1e |
84.7d |
91.5ab |
87.6cd |
|
CV (%) |
2.27 |
||||
|
LSD (at 5%) |
3.06 |
||||
Mean values that share the same latter (s) are not significantly different at p<0.05. CV (%) = Coefficient of variation, LSD (0.05) = Least significant difference
Number of Flowers Per Cluster
On the quantity of flowers per cluster, the impacts of tomato cultivars and mixed fertilizer (NPS) were shown to be significant (p = 0.0143 and 0.0001, respectively). But as Table 2 shows, their interaction impact was not statistically significant (p = 0.6773). The application of mixed fertilizer at a rate of 200 kg ha-1 produced the greatest and lowest number of flowers per cluster (7.6 and 5.6), respectively, followed by 150 kg ha-1 and control (0 kg ha-1). A substantial increase in primary branches per plant may have resulted from the highest mixed fertilizer level (NPS), as the tomato plant was able to absorb a sufficient amount of nutrients from the soil to produce an increased number of flowers per cluster.
The tomato plant may have absorbed enough nutrients from the soil at the maximum mixed fertilizer level (NPS) to generate a noticeable increase in primary branches per plant and an increase in the number of blooms per cluster. According to Table 6, Melka shola displayed the highest number of flowers per cluster (6.6), while Gelelma displayed the lowest number (6.386). The results of Ghimire39 who discovered that raising the nitrogen content from 112 to 224 kg ha-1 increased the number of flowers per cluster, were found to be consistent with this study.
Number of Fruits Per Cluster
The number of fruits per cluster was found to be significantly impacted by the blended fertilizer and tomato types (p = 0.0001 and p = 0.0029), whereas their interaction effect was determined to be non-significant (p = 0.667) (Appendix Table 2). The application of a mixed (NPS) fertilizer rate at 200 kg ha-1 and 150 kg ha-1, respectively, produced the largest number of fruits per cluster (7.3 and 6.9), whereas the least number of fruits per cluster was observed at control (0 kg ha-1).
The number of flowers per cluster increased gradually as blended fertilizer (NPS) fertilizer application increased from 0 kg ha-1 to 200 kg ha-1. This had a significant impact on producing the highest number of fruits per cluster because the tomato plant was able to absorb the ideal amount of nutrients from the soil. According to Table 6, Melka shola displayed the highest number of fruits per cluster (6.613), while Gelelma displayed the lowest amount (6.36). This could be because of a natural difference between the two tomato kinds, Melka shola and Gelelma, which causes Melka shola to yield more fruits per cluster.
This study is found to be in line with the findings of Gebisa23 who reported a significant difference in the number of fruits per cluster when comparing nine different tomato varieties, as well as Tesfaye27 who reported that the maximum number of fruits per cluster was achieved by applying a higher nitrogen fertilizer rate.
Number of Fruit Clusters Per Plant
As demonstrated in (AppPndix Table 2), the effects of the blended fertilizer and tomato types on the number of fruit clusters per plant were found to be significant (p = 0.0401 and p = 0.0135), while their interaction impact was not found to be significant (p = 0.57). The blended fertilizer rate of 200 kg ha-1, 150 kg ha-1, and 100 kg ha-1 produced the greatest number of fruit clusters per plant (27.2, 26.8, and 21.3), which were not statistically different from each other. The control rate produced the lowest number of fruit clusters per plant (0 kg ha-1) and 150, respectively.
It was discovered that the highest levels of mixed (NPS) fertilizer, 150 kg ha-1 and 200 kg ha-1, increased the amount of fruits and flowers per cluster. Additionally, this demonstrated a maximum production and notable increase in the quantity of fruit clusters per plant. It could be because there are nutrients available to nourish the fruit while the plant grows and develops. As indicated in Table 6, Melka shola displayed the highest number of fruit clusters per plant (26.213) whereas Gelelma displayed the lowest number of fruit clusters per plant (22.587).
This study supports Tadele’s40 conclusion that Melka shola produced the greatest amount of fruit clusters per plant. This was also found to be consistent with the results of Baran and Mamum41 who observed that the highest nitrogen level was associated with the greatest number of fruit clusters per plant, while the lowest number was associated with the control group. This study also supports the findings of Gebisa23 who tested nine different tomato cultivars and discovered that Melka shola had the greatest amount of fruit clusters per plant.
Table 6: The effects of the blended (NPS) fertilizer on the yield components of tomato varieties
|
Treatment |
Yields component parameters |
|||
|
Blended (NPS) fertilizer (kg ha-1) |
NFL/C |
NF/C |
NFC/Pt |
|
|
0 |
5.6e |
5.4e |
21.3b |
|
|
50 |
6.06d |
6.1d |
22.3b |
|
|
100 |
6.3c |
6.5c |
24.1ab |
|
|
150 |
6.7b |
6.9b |
26.8a |
|
|
200 |
7.6a |
7.3a |
27.2a |
|
|
LSD (at 5%) |
0.2 |
0.2 |
4.4 |
|
|
Tomato varieties |
||||
|
Melka shola 1 |
6.6a |
6.6a |
26.2a |
|
|
Gelelma 2 |
6.3b |
6.3b |
22.5b |
|
|
CV (%) |
3.3 |
3.5 |
14.8 |
|
|
LSD (at 5%) |
0.16 |
0.17 |
2.7 |
|
Mean values that share the same latter (s) are nonsignificant differences at p<0.05. CV (%) = Coefficient of variation, LSD (0.05) = least significant difference and while NFL / C = Number of flowers per cluster, NF/C = Number of fruits per cluster and NFC/Pt = Number of fruit clusters per plant
Yields
Number of Marketable Fruits Per Plot
The number of marketable fruits per plot was shown to be significantly impacted (p = 0.0015) by the interaction effects of the tomato cultivars and blended fertilizer (Appendix Table 3). The application of 200 kg ha-1 of blended (NPS) fertilizer rate and the Melka shola variety produced the maximum number of marketable fruits per plot (211.67), while the Gelelma variety and control (0 kg ha-1) produced the lowest number of marketable fruits per plot (41). (Table 7).
These indicated that the yield of marketable fruits per plot had increased with an increase in the application rate of mixed fertilizers (NPS) from 0 kg ha-1 to 200 kg ha-1, and that the tomato plant had absorbed all available nutrients from the soil to support fruit production, growth, and development
This result contrasts with that of Kirimi30 who found that applying nitrogen fertilizer during the course of his two-season trial on sandy loam soil with a pH of 5.7 had no discernible influence on the quantity of marketable fruits per plot. However, the results are consistent with a study by Lidia (2014), which revealed that the application of nitrogen fertilizer rates at 138 kg ha-1 resulted in the largest number of marketable fruits per plot and the lowest number at control. It also concurs with the results of Amin13, who established that 100 kg ha-1 NPS + 30 t ha-1 composted manure produced the greatest quantity of potato tubers that could be sold.
Table 7: Interaction: The effects of the blended fertilizer and tomato varieties on marketable fruit number per plot
|
Marketable fruit number per plot |
|||||
|
Treatment |
Blended (NPS) fertilizer (kg ha-1) |
||||
|
Tomato varieties |
0 |
50 |
100 |
150 |
200 |
|
Melka shola 1 |
74.67de |
126.67bc |
148b |
128.67bc |
211.67a |
|
Gelelma 2 |
41e |
77.67de |
91cd |
156.33b |
108.33cd |
|
CV (%) |
18.8 |
||||
|
LSD (at 5%) |
37.7 |
||||
Mean values that share the same latter (s) are not significant differences at p<0.05; CV (%) = coefficient of variation, LSD (0.05) = Least significant difference
Fruit Length (cm) and Fruit Width (cm)
The results indicated that the effects of tomato varieties had a greater significance (p = 0.0053 and p = 0.0039) on the length and width of the fruit, while the blended fertilizer rate (NPS) did not significantly affect either (p = 0.0792 and p = 0.998). Appendix Table 3 shows that their interaction effects, however, were determined to be nonsignificant (p = 0.4287 and p = 0.9044). As can be seen in Table 8, Gelelma had the greatest number of fruit lengths (9.98 cm) and widths (16.52 cm), whereas Melka shola had the lowest number of fruit lengths (9.40 cm) and breadth (15.47 cm).
This could be attributed to varietal differences and the genetic character of Gelelma, which produces greater fruit sizes, resulting in longer and wider fruits than Melka shola.
This study contradicts Tesfaye’s27 findings, which state that raising nitrogen levels increases fruit length and width while also encouraging fruit development. Similarly, it is not found in agreement with the findings of Ng ‘etich28, who discovered a larger fruit length in cucumber with the application of 120 and 160 kg ha-1 N level.
Marketable Fruit Yield Per Hectare (t ha-1)
The mixed fertilizer and tomato varietals had a highly significant (p = 0.0001) and non-significant (p = 0.1203) effect on marketable fruit output per hectare. However, their interaction was also determined to be nonsignificant (p = 0.1989) (see Tables 3 and 8 in the Appendix). The highest marketable fruit yield per hectare (15.383 t ha-1) was produced by applying a mixed (NPS) fertilizer rate of 200 kg ha-1, whereas the lowest marketable fruit yield per hectare (7.78 t ha-1) was reported at the control (0 kg ha-1).
The remaining later in the column did not show a statistically significant difference (Table 8). This suggests that increasing the application rate of blended fertilizers (NPS) from 0 kg ha-1 to 200 kg ha-1 gradually increased marketable fruit yield per hectare due to the continuous supply of available nutrients from the soil to support tomato fruit growth and development.
This study is similar with the findings of Lidia26 who discovered that the largest number of marketable fruit yield per hectare (49.30 t ha-1) was obtained by applying the highest quantity of nitrogen fertilizer (138 kg ha-1 N), while the lowest number was observed in the control group. Similarly, it is consistent with the findings of Ahmed29 who discovered that increasing nitrogen fertilizer levels enhanced tomato marketable fruit production per hectare.
Weight of Marketable Fruits by Size Group (g)
On the weight of marketable fruit by size group, the impacts of both tomato varieties and blended fertilizer (NPS) fertilizer showed a high significance (p = 0.0018 and p = 0.0001), and their interaction effect was not determined to be significant (p = 0.4068) (Appendix Table 3). The blended fertilizer rate at 150 kg ha-1 produced the greatest number of marketable fruit weights by size group (67.33 g), which was then followed by 100 kg ha-1 and 200 kg ha-1, respectively. The control rate (0 kg ha-1) produced the fewest marketable fruit weights by size group (63.16 g). This showed that there was a considerable rise in blended fertilizer rate (NPS) at a greater level, marketable fruit weight by size group as a result of the tomato plant absorbing the right quantity of nutrients from the soil during growth and development to achieve its typical fruit weight and size. Due to Gelelma’s inherent characteristics, it displayed the greatest number of marketable fruit weights by size group (67.4 g) compared to Melka shola, which displayed 63.8 g (Table 8).
The results of this study are found to be consistent with those of Girmachew32, who discovered that at a greater amount of nitrogen fertilizer (150 kg ha-1), the maximum marketable fruit weight per size group was reached. It also found to be consistent with the results of Lidia26 who reported that the lowest marketable fruit weight by size group at control and the maximum marketable fruit weight by size group at a higher level of nitrogen fertilizer rate (138 kg ha-1).
This result was also associated with EARO31, which categorized the standard fruit weight by size category as follows: small fruit weight (59–31 g), large fruit weight (>71 g), and 60–70 g.
Table 8: The effects of the blended (NPS) fertilizer on the yields of tomato varieties
|
Treatment |
||||||
|
Yields parameters |
||||||
|
Blended (NPS) fertilizer (kg ha-1) |
FL (cm) |
FW (cm)
|
MFY/H (t ha-1) |
MFWSG (g) |
||
|
0 |
9.30b |
15.23b |
7.783 c |
63.16c |
||
|
50 |
9.45ab |
15.85ab |
11.383b |
65bc |
||
|
100 |
9.71ab |
15.91ab |
13b |
66.3ab |
||
|
150 |
9.95a |
16.35a |
12.817b |
67.33a |
||
|
200 |
10.05a |
16.63a |
15.383a |
66.3ab |
||
|
LSD (at 5%) |
0.60 |
1.04 |
2.28 |
1.8 |
||
|
Tomato varieties |
||||||
|
Melka shola 1 |
9.40b |
15.47b |
12.6a |
63.8b |
||
|
Gelelma 2 |
9.98a |
16.52a |
11.5a |
67.4a |
||
|
CV (%) |
5.1 |
5.4 |
15.5 |
2.32 |
||
|
LSD (at 5%) |
0.3 |
0.6 |
1.4 |
1.1 |
||
Mean values that share the same latter (s) are not significant differences at p<0.05; CV (%) = Coefficient of variation, LSD (0.05) = Least significant difference, while FL =Fruit length, FW = Fruit width, MFY/H = Marketable fruit yield per hectare and MFWSG = Marketable fruit weight by size group.
Unmarketable Fruit Yield Per Hectare (t ha-1)
As shown in (Appendix Tables 4 and 9) the effects of blended fertilizer (NPS) fertilizer and tomato types on the unmarketable fruit output per hectare were found to be nonsignificant (p = 0.3864 and p = 0.0647), and their interaction impact was not found to be significant (p = 0.4852). The results of (Kirimi 30;Samaila33 who reported a significant increase in unmarketable fruit yield per hectare at the highest level of nitrogen (135 kg ha-1) and Lidia26, who reported a significant increase in unmarketable fruit yield per hectare at the highest level of 138 kg ha-1 N, are not consistent with the results of this study.
Unmarketable Fruit Number Per Plot
On the quantity of unmarketable fruits per plot, the impacts of the blended fertilizer and tomato types were found to be significant (p = 0.0179) and nonsignificant (p = 0.3689). However, it was shown that their interaction impact was not significant (p = 0.075) (Appendix Table 4). Melka Shola recorded the highest number of unmarketable fruit numbers per plot (79.6), whereas Gelelma demonstrated the lowest number of unmarketable fruit numbers per plot (61.8), as seen in Table 9. This could be the result of the highest possible output of Melka shola fruit, which led to physiological disorders and undersized fruits, increasing the quantity of unmarketable fruits per plot.
The results of this study are found to be consistent with those of Amin13, who conducted an experiment on the effects of blended (NPS) fertilizer rate (NPS) combined with cattle manure on potatoes and discovered a non-significant influence on unmarketable tuber potatoes. However, the results of Kirimi 30, who saw a marked rise in the quantity of unsaleable fruits in each plot with the greatest nitrogen content, did not support this finding.
Number of Total Fruit Yields Per Plant
On the total number of fruit yields per plant, the impacts of tomato cultivars and mixed fertilizer (NPS) were shown to be highly significant (p = 0.007 and 0.0002). As shown in (Appendix Table 4), their interaction impact did not, however, demonstrate a significant difference (p = 0.1087). The application of mixed fertilizer (NPS) at a rate of 150 kg ha-1 produced the highest number of total fruit yields per plant (55.617), while the control group (0 kg ha-1) produced the lowest number of total fruit yields per plant (39.683).
The maximum number of total fruit yields per plant production was influenced by the application of the highest blended (NPS) fertilizer rates, 150 kg ha-1 and 200 kg ha-1, which greatly enhanced the number of fruit clusters per plant. According to Table 9, Melka shola generated the greatest number of total fruit yields per plant (54.013) whereas Gelelma produced the fewest total fruit yields per plant (39.380).
The results of this study are consistent with those of Aminifard36, who observed that egg plants with a 100 kg ha-1 N level in loam soil with 0.05% nitrogen had the highest fruit output per plant. This is also consistent with the results of Lidia26, who found that applying nitrogen fertilizer at a rate of 138 kg ha-1 or 0 kg ha-1 would result in the maximum and least total fruit output per plant, respectively.
This study supports the findings of Salem41, who found that when he compared 30 tomato genotypes in Pakistan, the study produced the highest number of fruit yields per plant. Similarly, Chernet42 found that when he compared 36 tomato genotypes, the study produced the highest fruit yield per plant.
Total Fruit Yield Per hHectare (t ha-1)
The overall fruit output per hectare was found to be significantly affected by tomato varietals and mixed fertilizer (NPS) (p<0.0001 and p = 0.0102, respectively). Appendix Table 4 indicates that the interaction effect between them was not determined to be significant (p = 0.2232). A blended (NPS) fertilizer rate of 200 kg ha-1 produced the maximum total fruit yield per hectare (38.183 t ha-1), followed by 150 kg ha-1 and 100 kg ha-1, which were not found to be statistically different from one another. On the other hand, a control rate of 0 kg ha-1 produced the minimum total fruit yield per hectare (14.612 t ha-1), as shown in Table 9.
As a result of the available nutrients in the soil being absorbed and gradually supporting tomato plant fruit during growth and development, this demonstrated that increasing the blended fertilizer rate from 0 kg ha-1 to 200 kg ha-1 increased the number of fruit clusters per plant and the number of total fruit yields per plant, which led to the maximum production of total fruit yield per hectare. According to Table 9, Melka Shola had the highest total fruit output per hectare (26.570 t ha-1) whereas Gelelma produced the lowest total fruit yield per hectare (22.413 t ha-1). This could demonstrate how two tomato varieties naturally diverge from one another in order to maximize fruit yields from Melka shola rather than Gelelma.
This result is in line with the findings of Girmachew32 who reported the highest and lowest total fruit yield per hectare from application of nitrogen fertilizer rate at 150 kg ha-1 and control (0 kg ha-1), respectively.Warner and group conducted their experiment in sandy loam soils with organic matter contents of 2.75%. They reported the maximum and minimum total fruit yield per hectare at the highest level of nitrogen fertilizer 200 kg ha-1 and control (0 kg ha-1).
It was discovered to be consistent with the results of Gibisa23, who, after evaluating nine distinct tomato varieties, determined the maximum number of total fruit output per hectare from Melka shola. The results of Falak43 and Meseret25 who showed that the total fruit production per hectare ranged between 6.46 and 82.50 t ha-1, respectively, are also consistent with this.
This study also found agreement with the findings of Chernet42 who reported the highest fruit yield per hectare (50.07 t ha-1) after comparing 36 tomato genotypes, and Ketema15 who found that when comparing nine different tomato varieties, the Miya variety produced the highest total fruit yield per hectare (47.55 t ha-1).
Table 9.The effects of blended (NPS)fertilizer on yields of tomato varieties
|
Treatment |
Continue Yields parameter |
|||||
|
Blended (NPS) fertilizer (kgha-1) |
UnMFY/H (t ha-1) |
UnMFN/P |
NTFY/Pt |
TFY/H (t ha-1) 1st harvest |
TFY/H (t ha-1) 2nd harvest |
Total |
|
0 |
3.533a |
60.67a |
39.683b |
11.342c |
3.27c |
14.612c |
|
50 |
8.283a |
79.83a |
40.217b |
21.933b |
5.8b |
27.8b |
|
100 |
5a |
78.3a |
43.650b |
27.6a |
6.3b |
33.9a |
|
150 |
3.867a |
67.83a |
55.617a |
30.517a |
7.3a |
37.867a |
|
200 |
9.317a |
67.00a |
54.317a |
31.06a |
7.1ab |
38.183a |
|
LSD (at5%) |
7.4 |
22.6 |
10.273 |
5.1 |
1.3 |
5.5 |
|
Tomato varieties |
||||||
|
Melka shola1 |
8.213a |
79.6a |
54.013a |
26.57a |
6.28a |
32.85a |
|
Gelelma 2 |
3.787a |
61.8b |
39.380b |
22.413b |
5.6a |
28.08b |
|
CV (%) |
102 |
26.3 |
18.1 |
17.3 |
18.1 |
14.9 |
|
LSD (at 5%) |
4.72 |
14.2 |
6.4 |
3.2 |
0.8 |
3.4 |
Mean values that share the same latter (s) are not significantly different at p<0.05. CV (%) = Coefficient of variation, LSD (0.05) = least significant difference, while UMFY / H = Unmarketable fruit yield per hectare, UMFN/P = Unmarketable fruit number per plot, NTFY/Pt = Number of total fruit yields per plant and TFY/H = Total fruit yield per hectare.
Correlation Analysis
The correlation analysis revealed that numerous characteristics correlated positively with tomato variety growth, yield, and yield components. Increasing growth parameters resulted in enhanced yield and yield components in tomato varieties, demonstrating a positive connection (Appendix Table 5). As shown in Appendix Table 5, the total fruit yield per plant was positively correlated with the number of primary branches per plant (r = 0.59 ***), the number of leaves per plant (r = 0.61 ***), the number of fruit clusters per plant (r = 0.70 ***), the marketable fruit yield per hectare (r = 0.60 ***), and the number of marketable fruits per plot (r = 0.72 ***).As shown in (Appendix Table 5), the total fruit yield per hectare had a positive correlation with plant height (r=0.5***), days to 50% flowering (r=0.75***), days to 50% fruit maturity (r=0.7***), number of flowers per group (0.74***), number of fruits per group (r = 0.85***), percentage of fruit set (0.78***), marketable fruit yield per hectare (r=0.63***), and marketable fruit number per plot (r=0.57***).
This occurred as the growth parameters increased, resulting in an increase in yield and the parameter of the tomato’s yield component, indicating a positive correlation. This study is consistent with the findings of Ketema15 who found high significance and a positive association when evaluating ten distinct varieties for seed yield and tomato yield component.
Partial Budged Analysis
Partial budget analysis revealed that the highest net economic return of Ethiopian Birr (2948.3 and 2879.05) on total fruit yield per hectare was recorded at 100 kg ha-1 and 150 kg ha-1 of blended (NPS) fertilizer combined with Melka shola, while the lowest net return of Ethiopian Birr (1160.25) was obtained at the control (0 kg ha-1). The application of blended fertilizer (NPS) fertilizer at 100 kg ha-1 and 150 kg ha-1 mixed with Melka shola resulted in the highest marginal rate of return (49.86 and 48.69%), while the control yielded the lowest.
Due to the available amount of nutrients that the tomato plant absorbed to promote maximum fruit production and the genetic makeup of Melka shola, which produced the highest number of total fruit yield than Gelelma and yielded the highest economic return as shown in (Table 10), it appears that the application of the blended fertilizer rate from 0 kg ha-1 to 150 kg ha-1 was gradually increased both in net economic return and in marginal rate of return.
The results of this study are consistent with those of Amin13, who examined the partial budget for potatoes and discovered that the highest Ethiopian Birr was at 150 kg/ha of blended fertilizer (NPS) mixed with 20 t/ha of cattle manure. The control group had the lowest economic return of Ethiopian Birr.
Table 10: Result of partial budget analysis of the economic return of blended fertilizer and tomato varieties.
|
Treatments Combinations |
TFY/H (kg ha-1) |
(ETB) |
FC (ETB) |
NB (ETB) |
MRR % |
|
NPS kg ha-1+Variety |
|||||
|
0 +Melka shola |
33.15 |
1160.25 |
0 |
1160.25 |
0 |
|
50+Melka shola |
67.6 |
2366 |
98.55 |
2267.47 |
38.34 |
|
100+Melka shola |
95.5 |
3342.5 |
394.2 |
2948.3 |
49.86 |
|
150+Melka shola |
107 |
3766 |
886.95 |
2879.05 |
48.69 |
|
200+Melka shola |
94.7 |
3314.5 |
1576.8 |
1737.7 |
29.38 |
|
0+Gelelma |
34.9 |
1221.5 |
0 |
1221.5 |
0 |
|
50+Gelelma |
64 |
2240 |
98.55 |
2141.45 |
36.21 |
|
100+Gelelma |
70.1 |
2453.5 |
394.2 |
2059.3 |
34.82 |
|
150+Gelelma |
75.5 |
2642.5 |
886.95 |
1755.55 |
29.68 |
|
200+Gelelma |
91.5 |
3202.5 |
1576.8 |
1625.7 |
27.49 |
|
Total |
733.95 |
25709 |
5913 |
19796.27 |
111.437 |
TFY/H = total fruit yield per hectare; ETB= Ethiopian Birr; FC = fertilizer cost; NB = net benefit and MMR = marginal rate of return.
Summary and Conclusion
The Solanaceae family includes the tomato (Solanum lycopersicum L.), which has a standard number of chromosomes. Crop production efficiency is important, yet it falls short for a variety of reasons, such as plant nutrition and unpredictability. Using irrigation facilities, this study was conducted at the Jimma University College of Agriculture and Veterinary Medicine research site. It showed how the blended fertilizer and tomato cultivars significantly affected growth, yield, and yield component parameters.
The weight of the marketable fruit per size group, total fruit production per plant, and total fruit yield per hectare were found to be significantly impacted by both tomato varietals and mixed fertilizer (NPS). Tomato variety major effects were found to have a substantial impact on fruit width, length, and unmarketable fruit production per hectare. The marketable fruit yield per hectare was shown to be significantly impacted by the blended fertilizer (NPS) and tomato types. Additionally, the percentage of fruit set and the quantity of marketable fruits per plot were found to be significantly impacted by the interaction between the two fertilizers.
According to this study, at blended fertilizer rates of 150 kg ha-1, 200 kg ha-1, and control (0 kg ha-1) respectively, the maximum and minimum number of marketable fruit weights by size group, total fruit yield per plant and number of marketable fruits per plot, marketable fruit yield per hectare, and total fruit yield per hectare were obtained. With the exception of fruit length, fruit width, and marketable fruit weight by size group, Melka shola outperformed Gelelma in terms of the total number of marketable fruits per plot, total fruit production per plant, and total fruit output per hectare. Regarding tomato variety growth, yield, and yield components, correlation study revealed a strong positive correlation.
The tomato varietals and blended fertilizer (NPS) had a substantial impact on the economic return; Melka shola yielded a higher net economic return than Gelelma.
Generally speaking, using mixed (NPS) fertilizer rates at 150 kg ha-1 and Melka shola under Jimma conditions produced the best yield. However, because the research was done in a single place, the real recommendations from this study cannot now be addressed. Moreover, studies on the blended (NPS) fertilizer rate in conjunction with tomato types in Jimma circumstances may need to be conducted at several places.
Acknowledgement
Gambella University is acknowledged for providing the opportunity to carryout the above work. ‘FDRE Ministry of Education, Ethiopia’ is acknowledged for providing the funding. Jimma University is acknowledged for providing the platform to carryout the above work. All spervisors, technical, theoretical assistance(laboratory and field) are sincerely acknowledged in this regard.
Funding Sources
Project was funded by ‘Funding agency: FDRE Ministry of education, Ethiopia’
Conflict of Interest
The authors state that they have no conflict of interest.
Data Availability Statement
The above data discussed is available with the authors.
Ethics Statement
This research did not involve human participants, animal, subjects, or any material that requires ethical approval.
Informed Consent Statement
This study did not involve human participants, and therefore, informed consent was not required.
Authors’ Contribution
Khat Gach Ger: Project conceptualization, investigation, project execution, basic writing.
Derbew Belew: Project conceptualization, supervision, guidance, Resources provision.
Amsalu Nebiyu: Project supervision, Resources provision.
John Barnabas: Project report writing, editing, communications, technical support.
References
- Peralta, I., Knapp, S., Spooner, D and Lammers, T. 2005. New species of wild tomatoes (Solanum section Lycopersicon: Solanaceae) from northern peru. Systematic Botany. 2005, 30: 424–434.
CrossRef - Peralta, I., Spooner, D and Knapp, S. 2008. Taxonomy of wild tomatoes and their
relatives,(Solanum lycopersicon L), sect. Juglan difolia, sect. Lycopersicon;
Solanaceae). American Society of Plant Taxonomists, 2008 pp: 151–160. - Blanca, J., Cañizares, J., Cordero, L., Pascual, L., Diez, M.J and Nuez, F. 2012. Variation
revealed by SNP genotyping and morphology provides insight into the origin of
the tomato. PloS One 2012.pp: 48-198. - Lin, T., Zhu, G., Zhang, J., Xu, X., Yu, Q., Zheng, Z., Zhang, Z., Lun, Y., Li, S., Wang, X and Huang, Z. 2014. Genomic analyses provide insights into the history of tomato breeding. Nature genetics 2014, 46(11), pp.1220-1226.
CrossRef - FAO. 2017. FAO Production Year Book. Basic Data Unit, Statistics Division, FAO, Rome , Italy 2017,, No. 55, pp 125-127.
- Olayemi, F.F., Adegbola, J.A., Bamishaiye, E., I and Daura AM. 2010. Assessment of postharvest challenges of small scale farm holders of tomatoes. Bell and hot pepper in some local government area of Kano State, 2010 pp.23-29.
CrossRef - Poobalan, V., Praneetha, S., Arumugam, T., Kumaravadivel, N. and Jeyakumar, P. Medicinal properties of vegetable crops. International Journal of Current Science, 7(5), pp.1538-1542.
- AVRDC. 2004. Medium-term plan, 2004-2006. High lights. 2004 AVRDC-The World Vegetable Center, Shanhua, Taiwan.
- Gemechis, A.O., P.C. Struik and B. Emana. 2012. Tomato production in Ethiopia: Constraints and opportunities 2012.
- Emanan, B., A. Ayana., T. Balemi and M. Temesgen. 2014. Scoping study on vegetables seed systems and policy in Ethiopia. Final Report 2014, Asian Vegetable Research and Development Center, Shanhua, Taiwan.
- Kibret, K., Marohn, C. and Cadisch, G. 2016. Assessment of land use and land cover change in South Central Ethiopia during four decades based on integrated analysis of multi-temporal images and geospatial vector data. Remote Sensing Applications: Society and Environment, 2016 (3), pp.1-19.
CrossRef - Ketema, B., Derbew, B and Jima, N. 2016. Evaluation of Tomato (Lycopersicon esculentum) Varieties for Growth and Seed Quality under Jimma Condition, South Western Ethiopia. International. Journal of Crop Science and Technology 2016, Vol2. Pp: 69-77.
- Amin, A. 2018. Integrated use of NPS blended fertilizer and cattle manure for growth, yield and quality of potato (Solanum tuberosum ) M.Sc. 2018 Thesis Submitted to College of Agriculture and Veterinary Medicine, Jimma University.
- EthioSIS. 2014. Soil Fertility and Fertilizer tentative recommendation oromia Region 2014. Ministry of Agriculture (MoA) and Agricultural Transformation Agency (ATA).
- Ketema, B., Derbew, B and Jima, N. 2015. Evaluation of Tomato (Lycopersicon esculentum ) Varieties for Seed Yield and Yield Components under Jimma Condition, South Western Ethiopia. 2015 Journal of Agronomy, 14: 292-297.
CrossRef - Mulugeta S, Sentayehu A and Kassahun B. 2016. Stability analysis of grain yield in rice genotypes across environments of Jimma Zone, South Western Ethiopia, academic Journal of Cereals and Oil seed, 2016 Vol. 7, ISSN 2141-6591.
CrossRef - BPEDORS. 2000. Physical and socio economical profile of 180 District of Oromia Region. Bureau of Planning and Economic Development of Oromia Regional State, Physical Planning Development, Addis Ababa, Ethiopia, pp: 248-251.
- Sahlemedhin, S and Taye, B. 2000. Procrdures for soil and plant anlysis. National Soil Research Centre. Ethiopian Agricultural Research Organization, Addis Ababa, Ethiopia. 2000 pp: 110.
- Kamara, C.S., I. Haque and A.R. Soka. 1992. Soil Physics Manual. Plant Science Division Working Document No. B.12 (Revised) ILCA, Addis Ababa, Ethiopia, 106p.
- Dewan, H and Amasu, N. Physical and Chemical Methods for Soil. Water and Fertilizers DP/ETH/82/011. Field document 1. NSSP. Addis Ababa, Ethiopia.
- Yerima, B., Mathieu and F. Pieltain. 1990. Manual des analysis des sols realisée an laboratorie du BNPCS tome I revisé. Rapport technique No. 12. Projet PNUD/FAO/CAF/82/007. RCA Bangui.
CrossRef - Eshetu, M. 2018. Effect of Inter-Row Spacing and Nitrogen Rates on Growth, Yield Components, and Yield of Okra (Abelmoschus esculentus (L.) Moench) at Assosa, Western Ethiopia. Life Sci J 2018;15(9):1-16.
- Gebisa, B., Gezu. D., Alemayehu. B and Fikadu, T. 2017. Performance evaluation of tomato (Lycopersicon esculentum) varieties under supplemental irrigation at Erer Valley, Babile District, Ethiopia. Journal of Plant Sciences. Vol. 5(1), pp. 1-5.
- Ogundare, S., Badalona, T., Hinmikaiye, A and Oloniruha, J. 2015. Growth and Fruit yield of tomato as influenced by combined use of organic and inorganic fertilizer: European Journal of Agriculture and Forestry Research .Vol.3,48-56.
- Meseret, D., Ali, M. and Kassahun, B. 2012. Evaluation of tomato (Lycopersicon esculentum) genotypes for yield and yield components. The African Journal of Plant Science and Biotechnology, pp 45-49.
- Lidia, B. 2014. Response of nitrogen and phosphorous fertilizer rate on growth, yields and quality of Tomato (Lycopersicon esculentum), M.Sc. Thesis Submitted to College of Agriculture and Veterinary Medicine, Jimma University.
- Tesfaye, B. 2008. Response of tomato cultivars differing in growth habit to nitrogen and Phosphorus fertilizers and spacing on vertisol in Ethiopia. Acta agricultural Slovenica 2008, p:1-9.
- Ng’etich, O.K., Niyokuri, J.J., Rono, A., Fashaho and A.O.Ogweno. 2013. Effect of different rate s of nitrogen fertilizer on growth and yield of Zucchini (cucurbita pepo CV diamant L) Hydride F1 in Rwandan high altitude Zone. International Journal of . Agricultural Crop Science 2013. Vol. 5(1):54-62.
- Ahmed, T., Munsur, A., Khantum, A., Majumdar and A. Sarker. 2012. Increase tomato yield through maximization of nitrogen fertilization. Bangladesh research publications J.7 (4): 336-344.
- Kirimi, J., Itulya, F and Mwaja, V. 2011. Effects of nitrogen and spacing on fruit yield of tomato. J. Horticulture. Sci. 20115:50-60.
- EARO. 2004. Directory of released crop varieties and their recommended cultural practices. 2004 Addis Ababa, Ethiopia.
- Girmachew, T. 2007. Effects of planting method and nitrogen rate on yield and quality of tomato (Lycopersicon esculentum Mill). 2007 M.Sc. Thesis submitted to School of Graduate Studies of Haramaya University.
- Samaila, A., Amans, E., Abubakar, I and Babaji, B. 2011. Nutritional quality of tomato (Lycopersicon esculentum Mill) as influenced by mulching, nitrogen and irrigation interval.Journal of Agricultural Science 2011. 3(1): 266 – 270.
CrossRef - Gomez, K and Gomez, A. Statistical Procedure for Agricultural Research–Hand book 1984. John Wiley & Sons. New York, 693p.
- CIMMY.1988. From agronomic data to farmer recommendations: an economics training manual (completely revised edition). CIMMYT, Mexico, DF, pp.9-38.
- Aminifard, M., Aroiee, H., Fatemi, H., Ameri and Karimpour. S. 2010. Response of eggplant (Solanum melongena L.) to different rates of nitrogen under field conditions. Journal of Central Europe 2010. Agric.11 (4): 453-458.
- Khan, S., Rehman, S., Khan, A.Z., Khan, M.A and Shan, M.T. 2010. Soil and Vegetables enrichment with heavy metals from geological sources in Gilgit, northern Pakistan. Ecotoxicology and Environmental Safety 2010:73, 1820-1827.
CrossRef - Hampton, M., F.Kiran and G. McAvoy. 2012. Blossom drop, reduced fruit set and post-pollination disorders in tomato. Access on 2013.
CrossRef - Ghimire, S., Shakya, S.M. and Srivastava, A. 2013. Sweet pepper production using different nitrogen sources in subtropical climate. Direct Research Journal of Agriculture and Food Science,1(1), pp.6-10.
- Tadele, S. 2016. Evaluation of Improved Tomato Varieties (Lycopersicon esculentum ) performance against major Insect Pests under open field and glasshouse conditions. International Journal of Research Studies in Agricultural Sciences (2), pp 1-7
CrossRef - Salem, M., M. Asghar and Q. Iqbal. 2013. Augmented analysis for yield and some yield components in tomato (Lycopersicon esculentum ). Pakisthan. Journal of Botany., 45: 215-218.
- Chernet, S., D. Belew and F. Abay. 2013. Genetic variability and association of characters in tomato (Solanum lycopersicon), genotypes in Northern Ethiopia. Intional Journal of Agricultural Research 8: 67-76.
CrossRef - Falak, N., Ihsan, U., Syed, A., Abdus, S and Abdur. R. 2011. Studies on growth, yield and nutritional composition of different tomato cultivars in Battal Valley of district Mansehra, Kyyber Pakhtunkhwa, pakistan, Journal of agriculture 2011 27 (4), 570-571.
- Mehmood, N., Ayub, I., Ullah, N., Ahmad, M., Noor, A., Muhammad, S., Ahmad, A., Saeed and Farzana. 2012. Response of tomato cultivars to nitrogen levels. Pure Applied Biology., 2012 11(3):63-67.
CrossRef
List of Abbreviations and Acronyms
|
ANOVA |
Analysis of Variance |
|
AVRDC |
Asian Vegetable Research and Development Center |
|
BPEDORS |
Bureau of Planning and Economic Development of Oromia Regional State |
|
CV DAP ADP ATP |
Coefficient of variation Di-ammonium Phosphate Adenosine Di-Phosphate Adenosine Tri-Phosphate |
|
EARO |
Ethiopian Agricultural and Research Organization |
|
FAO |
Food and Agricultural Organization |
|
FAOSTAT JUCAVM |
Food and Agricultural Organization of the United Nations Statistics Jimma University, College of Agriculture and Veterinary Medicine |
|
LSD MARC |
Least Significant Difference Melkassa Agricultural Research Center |
|
MoA NPS |
Ministry of Agriculture Nitrogen, sulfur and phosphor |
|
RCBD SAS |
Randomized Complete Block Design Statistical analysis system |
Appendix
Appendix Table 1: Mean squares values on growth parameter of tomato varieties
|
SV |
Df |
PH (cm) |
NPB/Pt |
NL/Pt |
D50% FL |
DFF |
D50% FM |
|
Rep |
2 |
24.36ns |
3.60ns |
263.20ns |
1.03ns |
0.93ns |
2.7ns |
|
NPS |
4 |
74.84** |
5.9475** |
344.3* |
73.9*** |
95.86*** |
65.9*** |
|
Var |
1 |
114.46* |
31.212*** |
717.3* |
50.7* |
45.63* |
26.13* |
|
NPS*Var |
4 |
9.50ns |
2.72ns |
2.06ns |
8.11ns |
5.63ns |
11.38ns |
|
Error |
18 |
13.8 |
0.79 |
105.4 |
7.8 |
7.74 |
5.29 |
|
CV (%) |
6.7 |
8.3 |
13.6 |
7 |
6.6 |
3.19 |
Where, * Significant at P≤ 0.05, ** highly significant at P≤ 0.01, *** vey highly significant at P≤ 0.001, NS= non-significant at P≥0.05, DF= degree of freedom, SV= source of variation and whereas PH = Plant height, NPB/Pt = Number of primary branch per plant, NL/Pt =Number of leaves per plant, D50%FL = Days to 50% flowering, DFF = Days to first fruiting and D50%FM = Days to 50% fruit maturity.
Appendix Table 2: Mean Squares values on yield components parameters of tomato varieties
|
SV |
Df |
NFL/C |
NF/C |
NFC/Pt |
FS% |
|
Rep |
2 |
0.072ns |
0.028ns |
208.8N*** |
6.7ns |
|
NPS |
4 |
3.60*** |
3.38*** |
41.32* |
1104.96*** |
|
Var |
1 |
0.34* |
0.45** |
98.64* |
32.86** |
|
NPS*Var |
4 |
0.027ns |
0.032ns |
9.87ns |
36.11*** |
|
Error |
18 |
0.046 |
0.053 |
13.1 |
3.1 |
|
CV (%) |
3.3 |
3.5 |
14.8 |
2.27 |
Where, * Significant at P≤ 0.05, ** highly significant at P≤ 0.01, *** very highly significant at P≤ 0.001, NS= non-significance at P≥0.05, DF= degree of freedom, SV= source of variation and whereas NFL/C =Number of flowers per cluster, NF/C = Number of fruit per cluster, NFC/Pt = Number of fruit cluster per plant and FS% = Fruit set percentage.
Appendix Table 3: Main squares values on yields parameter of tomato varieties
|
SV |
Df |
FL (cm) |
FW (cm) |
MFY/H ( t ha-1) |
MFN/P |
MFWSG (g) |
|
Rep |
2 |
3.53*** |
4.67** |
17.10ns |
1254.4ns |
4.63ns 15.53** |
|
NPS |
4 |
0.61ns |
1.71ns |
46.8*** |
9336.6*** |
|
|
Var |
1 |
2.46** |
8.2** |
9.4ns |
13910.5*** |
93.63*** |
|
NPS*Var |
4 |
0.24ns |
0.18ns |
5.9ns |
3357.36** |
2.46ns 2.3 |
|
Error |
18 |
0.24 |
0.7 |
3.5 |
483.6 |
|
|
CV (%) |
5.10 |
5.4 |
15.5 |
18.8 |
2.3 |
*Significant at P≤ 0.05, ** highly significant at P≤ 0.01, *** very highly significant at P≤ 0.001, NS= non-significance at P≥0.05, DF= degree of freedom, SV= source of variation and whereas FL =Fruit length, FW = Fruit width, MFY/H = Marketable fruit yield per hectare, MFN/P = Marketable fruit number per plot and MFWSG = Marketable fruit weight by size group
Appendix Table 4: Mean squares values on yields parameter of tomato varieties
|
SV |
Df |
UnMF/H (t ha-1) |
UnMF/P |
TFY/Pt |
TFY/H (t ha-1) 1st harvest |
TFY/H (t ha-1) 2nd harvest |
Total |
|
Rep |
2 |
76.86ns |
552.43ns |
262.9ns |
11.9ns |
2.11ns |
5.74ns |
|
NPS |
4 |
41.77ns |
396.38ns |
357.1** |
402.9*** |
15.94*** |
576.88*** |
|
Var |
1 |
146.96ns |
2358.5* |
1606*** |
129.5* |
2.83ns |
170.74* |
|
NPS*Var |
4 |
34.10ns |
1421.7ns |
158.58ns |
38.4ns |
1.14ns |
32.71ns |
|
Error |
18 |
37.9 |
347.32 |
71.72 |
18.06 |
1.18 |
20.73 |
|
CV (%) |
102.6 |
26.34 |
18.13 |
17.3 |
18.2 |
14.94 |
Where, * Significant at P≤ 0.05, ** highly significant at P≤ 0.01, *** very highly significant at P≤ 0.001, NS= non significance at P≥0.05, DF= degree of freedom, SV= source of variation; UnMF/H = Unmarketable fruit yield per hectare, UnMFN/P = Unmarketable fruit number per plot, TFY/Pt = Total fruit yield per plant and TFY/H = Total fruit yield per hectare.
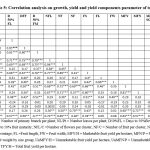 |
Appendix Table 5: Correlation analysis on growth, yield and yield components parameter of tomato varieties |