
Introduction
As the world’s population continues to grow (8.5 billion by 2030 and 9.7 billion by 2050), it will be essential to produce more foods to secure the growing population in near future 1,2. Therefore, the agricultural production should be increased from 60% to 110% by 2050 to meet these increasing demands 3. In general, there are two ways of increasing crop production; 1) extend the cultivation area, 2) increase the yield in unit area. Expansion of the crop area is influenced by several factors, such as prolonged drought, crop failure, pest and disease damage, labour shortage, and high cost of fertilizer 4,5. To meet the rising food demands of global population, it is becoming more crucial to enhance the crop production in unit land area 6. It is crucial to increase resource use efficiency, particularly for small–scale farmers in regions with short growing seasons 7 and rainfed areas 8. To overcome these challenges, increasing crop production per unit area is a fruitful pathway to utilize the farm resources such as land, labour, capital, water, fertilizer, solar energy, and other environmental factors 6,9,10. Due to the abrupt change in climate in recent decades, farmers have been facing crop failure in the monocropping system. To solve the problems, practicing the intercropping systems is extremely important to safeguard the farmers from failure and ensure the maximum utilization of farm resources and environmental factors.
Intercropping is defined as ‘an agricultural practice of cultivating two or more crops in a given area (spatial) at the same time (temporal) with a definite row arrangement’ 11,12. The main benefits of intercropping include increasing yield, better use of growth resources, sharing of physical support, shade and shelter amongst the crops, improved soil erosion control, and protection for small farmers when one crop may fail and by making the best possible use of the land and labour resources available over a specific period of time 13–17. Intercropping of crops ensures efficient resource utilizations by crops with varying heights, rooting depths, and nutrient requirements, reduces soil erosion, and suppresses weed growth, all of which contribute to greater crop yield stability 18,19. The relatively high yield can be obtained by intercropping systems due to the complementarity use of environmental resources such as land, soil nutrients, light, and water 20 at temporal and spatial exploitation of available resources 21.
In the okra–cowpea intercropping system, intercropping ensures efficient use of environmental factors and other resources to maximize crop yield 18. The okra is widely cultivated in tropical and sub–tropical climatic conditions. Immature pods are harvested as the economic yield of the okra 22. Okra is one of the most important commercial vegetables in Sri Lanka and is used by people in their daily lives 23. Cowpea is the most significant crops in fulfilling this role among the various leguminous plants, and currently offer excellent potential for maintaining soil fertility over time 24,25.
Intercropping systems are typically assessed through either growth and yield performance or cropping indices. However, relying solely on growth and yield data for evaluation is not sustainable way. Intercropping involves two or more crops, subject to various influences such as land area, crop maturity, resource allocation, competition, and environmental conditions. These factors significantly impact system performance. Cropping indices offer a more comprehensive approach to evaluating intercropping systems. They consider the interactions between crops and their environment, providing insights beyond growth and yield parameters. The effectiveness of intercropping systems in comparison to monocropping was evaluated using a variety of metrics. Several cropping indices were proposed to describe crop competition, yield advantages, utilization of farm resources, and economic benefits 26–30. By incorporating cropping indices can better capture the efficiency and sustainability of intercropping practices. This holistic evaluation approach enables farmers and researchers to make informed decisions regarding crop selection, resource allocation, and management strategies, ultimately contributing to more resilient and productive agricultural systems. Thus, while growth and yield analysis remain essential, integrating cropping indices enhances the precision and effectiveness of intercropping system evaluations, paving the way for more sustainable agricultural practices. However, selecting a suitable cropping system through the evaluation of the crop performance in an intercropping system using cropping indices was limited. Therefore, we designed the different intercrop combinations for okra and cowpea to select suitable intercropping systems. The objectives of the study were 1) to assess the okra–cowpea intercropping systems based on growth and yield parameters; 2) to evaluate the okra–cowpea intercropping systems using cropping indices such as yield efficiency, crop competition, and land utilization efficiency indices.
Materials and Methods
Study Site
The experiment was conducted at the Crop Farm, Department of Agronomy, Faculty of Agriculture, University of Jaffna in Kilinochchi district, Sri Lanka. The study site is located at geographical coordinates of 80° 39 E’ longitude and 9° 32 N’ latitude. The study area comes under the agroecological zone of dry zone low county (DL3), northern region of the country. The climate conditions during the experiment were characterized as dry and hot based on the agroecological zone of the country. The average elevation of the study area is about 67 m above mean sea level. This location’s average annual air temperature ranged from 28 ℃ to 33 ℃, and the average annual precipitation ranged from 1,040 mm to 1,560 mm 31,32. The experiment was conducted between the first week of March and the last week of June 2022, coinciding with the season of the selected crops 33.
Experimental Set Up
The crops okra and cowpea were chosen as the experimental crops for this study. Okra [Abelmoschus esculentus (L.) Moench.] is one of the major and commercial vegetables in Sri Lanka and it belongs to the family of Malvaceae 23,34. The maturity period of Okra is 90 to 100 days, and its height ranges from 0.5 to 4.0 m 35,36. The okra can be cultivated in any agroclimatic zone, except in the upcountry wet zone. The okra variety Haritha is more suitable for dry zone than wet zone and it is resistant to leaf mosaic virus. The first harvest can be done in about 50 days. It can produce an average yield is about 10-15 t ha-1. The cowpea [Vigna unguiculata (L.) Walp.] is one of the major pulse crops in Sri Lanka and belongs to the family of Fabaceae 33. The cowpea is a drought–tolerant crop and can cultivated in low rainfall areas 37. The cowpea variety Waruni has characteristics of erect and determinate growth habits and is suitable for intercropping with vegetables. It takes about 55-65 days to harvest and can produce an average yield of 1.6 t ha-1. In our study, the selected varieties Haritha and Waruni have a maturity period of 90 and 70 days, respectively 33.
To find the performance of the cropping systems, different okra–cowpea intercropping systems were designed. Three intercropping systems as treatments with three replicates laid out at a Randomized Complete Blok Design (RCBD) (Table 1) such as single row of okra with single row of cowpea (T1), single row of okra with double–row of cowpea (T2), and double–row of okra with single row of cowpea (T3). The recommended spacing was applied to design the different intercropping systems (Fig. 1). In addition to the intercropping systems, monocropping of each crop was established with three replicates to evaluate the cropping indices as per the formula. In the monocropping system, the spacing of okra and cowpea was 90 cm × 60 cm, and 45 cm × 15 cm, respectively. In intercropping systems, inter–row spacing was varied according to the design of the intercropping system. Maximum spread of a crop’s canopy allowed in between the rows based on the recommended spacing to avoid the canopy overlapping. We calculated the inter–row spacing in the intercropping system based on the maximum canopy spread of okra and cowpea in between the rows. Due to this, the plot size of the treatments (T2 and T3) was varied. Intra–row spacing was maintained as monocropping systems for all treatments. Intra–row spacing for okra and cowpea were 60 cm and 15 cm, respectively. To avoid the boarder effect, additional plots were established in surroundings of each treatment.
Table 1: Experimental treatments with the spacing in inter–row and intra–row and plot size.
|
Treatment |
Treatment description |
Inter–row spacing |
Intra–row spacing |
Plot size |
|
T1 |
Single row of okra with single row cowpea |
Between okra and cowpea: 67.5 cm |
Okra: 60 cm; cowpea: 15 cm |
3.6 m × 3 m |
|
T2 |
Single row of okra with double–row of cowpea |
Between okra and cowpea: 67.5 cm; within the cowpea (double–row): 45 cm |
Okra: 60 cm; cowpea: 15 cm |
3.6 m × 2.6 m |
|
T3 |
Double–row of okra with single row of cowpea |
Between okra and cowpea: 67.5 cm; within the okra (double–row): 90 cm |
Okra: 60 cm; cowpea: 15 cm |
3.6 m × 4.05 m |
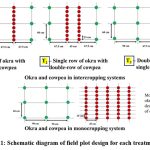 |
Figure 1: Schematic diagram of field plot design for each treatment. |
Field Preparation and Planting
The land was ploughed using a disc plough and then, the soil was made as fine tilth condition using a rotavator. The area was raked using a field rake to remove weeds, stones, soil clods, and other undesired items. Blocking for treatments was done perpendicular to the slope as a gradient to eliminate the source of error such as moisture and nutrients. Each block was designed as field plots to comprise all treatments. Prepared plots were marked into planting holes for seeding of okra and cowpea. Okra and cowpea were row–seeded in the field according to the treatment’s layout. Around 2 seeds were planted in one hill for both okra and cowpea 33.
Crop Management Practices
The agronomic management practices were done according to the recommendation of the Department of Agriculture, Sri Lanka. For both cowpea and okra, irrigation was given at 2–day intervals at the initial stage to maintain continuous moisture and ensure maximum germination. Then, the irrigation interval was increased to 4 days throughout the experimental period. However, irrigation was determined based on the moisture condition of the soil. Surface–flood irrigation was applied to the soil for maintaining a 50 mm water depth. The fertilizer was applied based on the recommendation of each crop (Table 2). The nitrogen (N), phosphorous (P), and potassium (K) was applied through urea (46% N), Triple super phosphate (TSP) (44% P2O5), and muriate of potash (MOP) (60% K2O), respectively 38. For okra, the first application of fertilizer was done as a basal mixture consisting of urea, TSP and MOP. Then the fertilizer was applied three times as top dressing (TD1 – TD3) consisting of urea and MOP, 2 weeks after planting (2–WAP), 5–WAP, 8–WAP, respectively. For cowpea, the first dose of fertilizer applied as basal mixture consisted of urea, TSP, and MOP, then it was applied as TD1 at once during the flowering stage 33.
Table 2: Amount and frequency of fertilizer application for okra and cowpea
|
Treatment |
|
Urea (kg/ha) |
TSP (kg/ha) |
MOP (kg/ha) |
|
Okra |
Basal |
50 |
195 |
25 |
|
TD1 (2–WAP) |
100 |
50 |
||
|
TD2 (5–WAP) |
100 |
50 |
||
|
TD3 (8–WAP) |
100 |
50 |
||
|
Cowpea |
Basal |
35 |
100 |
75 |
|
TD1 |
30 |
TSP – Triple super phosphate; MOP – Muriate of potash; TD – Top dressing; WAP – Weeks after Planting
Two weeks after the sowing of seeds, thinning out was done for both okra and cowpea. The seedlings were thinned at 7–8 cm tall. The unhealthy and unvigoured seedlings were removed during the thinning operation. Manual weeding was done at every 2–week intervals. Fertilizer was applied after removing weeds for both okra and cowpea. Insect pests such as blister and cucumber beetles were found at the initial stage of the crop’s growth. Fruit borer damage was observed at the pod formation stages of cowpea and okra. Recommended insecticides were used to control these insect–pest damages 33.
Harvesting of Crops
The fruit was harvested when it was of marketable size and quality, a stage at which it could be sold to the market 39. We followed the marketable size and quality of okra and cowpea as immature and mature stages, respectively. For okra, harvesting was started 50 days after planting. Harvesting was done by hand with the stalk at 2–day intervals in the morning to avoid damage to the pods. The harvesting time of okra was decided when the pods were in the immaturity stage and easily snapped off the tender shoot. For cowpea, harvesting was started 50 days after planting when pods were fully matured. The harvesting time of cowpea was decided by the indication of turning of pods’ colour from green to pale yellow. The cowpea seeds were separated by crushing them with sticks after drying well in the sun for 2–3 days. After that, cleaned seeds were dried until the moisture content was about 10% and stored them in air-tight packages in a dry and cool place 33,40.
Recording of Growth and Yield Parameters
Growth and yield parameters were recorded during the vegetative, reproductive, and maturity periods (Table 1). From each treatment, five plants were selected randomly and tagged per plot and from which, all the growth parameters were measured. The yield of both crops was recorded per plot for all treatments.
Growth Parameters
Plant height of okra and cowpea was measured in cm at 2–week intervals. Plant height was recorded by measuring the length of the selected plant from the bottom of the stem to the terminal bud 41. Number of leaves and branches per plant in both okra and cowpea was counted.
Yield Parameters
For okra, the number of flowers per plant, number of pods per plant, pod yield per hectare (t ha 1), weight per pod (g), pod length (cm), and pod circumference (cm) were measured. For cowpea, number of flowers per plant, number of pods per plant, pod yield per hectare (t ha-1), and grain yield per hectare (t ha-1), number of grains per pod, and pod length (cm) were measured. After each picking, the yield of okra and cowpea was recorded in treatment wise. When the picking was completed, the yield per plant of individual treatment was enumerated. The number of pods per plant for okra and cowpea was counted. The average pod weight of okra was measured at the end of the experiment, and it is a proportion of the total yield weight to the total number of pods. The pod weight was measured using a digital balance. In okra and cowpea, pod length was measured using meter tape from randomly selected five pods on each treatment and then the average was calculated. The circumference of the okra pod was measured with the help of thread and meter tape. The average number of grains per pod was counted for cowpea from randomly selected five pods in treatment wise and then the average was calculated. In cowpea, grain yield was recorded in kg when constant weight was achieved after drying.
Table 3: Parameters measured for growth and yield of okra and cowpea.
|
Parameter category |
Parameter |
|
Growth parameters |
Plant height (cm) |
|
Number of leaves per plant |
|
|
Number of branches per plant |
|
|
Yield parameters |
Number of flowers per plant |
|
Number of pods per plant |
|
|
Pod yield per hectare (t ha-1) 1 |
|
|
Weight per pod (g) |
|
|
Length of the pod (cm) |
|
|
Circumference of the pod (cm) 2 |
|
|
Grain yield per hectare (t ha-1) 3 |
|
|
Number of grains per pod 4 |
1 Fresh pod weight was measured for okra as it is marketable yield, while dry pod weight was measured for cowpea as it is marketable yield; 2 only measured for okra as it is harvested as fresh pod weight; 3,4 measured for cowpea as it is harvested as dry pod
In addition to the growth and yield parameters, we measured the chlorophyll content of the leaf using a SPAD Chlorophyll meter.
Evaluation of Cropping System Using Cropping Indices
The following cropping indices were used. The cropping indices were categorized into yield efficiency indices, crop competition indices, and land utility efficiency indices for evaluation.
Yield Efficiency Indices
Harvest index (HI), Land equivalent ratio (LER), relative yield total (RYT), and area time equivalent ratio (ATER) were used to estimate the efficiency of yield.
Harvest Index (HI)
The harvest index (HI) is a well–known index used to evaluate the yield efficiency at the time of harvest. It is calculated using the economic yield of the crop divided by the total biological yield 42,43. If the economic yield is 50 % of the total, then the HI value was 0.5. A high value indicates the good yield of the crops. HI for okra and cowpea were calculated using the following equation (1) and (2), respectively.
HI okra = Y okra pod/Y okra biological total (1)
HI cowpea = Y cowpea pod/Y cowpea biological total (2)
Where, Y = yield of the respective crop in each treatment
Land Equivalent Ratio (LER)
The LER represents how much additional land area is needed for establishing the monocropping system in order to get the same crop production in an intercropping system (Equation 3). The LER indicates that intercropping system use the resources efficiently than monocropping system 44. Yield is considered as advantage when LER value is greater than one, likewise, yield is disadvantage when the LER value is less than 1 45. When the LER =1, there is no gain or no loss in yield.
LER = (Yi okra/Ym okra) + (Yi cowpea/Ym cowpea) (3)
Where, Yi = intercrop yield; Ym = monocrop yield
Relative Yield Total (RYT)
The RYT measures how much yield is to be obtained from the intercropping system when the population is maintained as same as in the monocropping system. The RYT is sum of a proportion of intercrop yields of a crop to monocropping yield of component crop from the same replacement series (Equation 4). The RYT represents the yield advantage based on unit area and unit population. When the LER is calculated at equal amount of plant population in unit area basis then it is known as RYT 46–48.
RYT = (Yi okra + Yi cowpea)/ (Ym okra + Ym cowpea) (4)
Where, Yi = intercrop yield; Ym = monocrop yield
Area Time Equivalent Ratio (ATER)
In addition to the yield of each intercrop, the ATER includes the cropping maturity period of each crop in a cropping system (Equation 5) compared to the HI, LER, and RYT. The ATER is more explainable than LER and RYT 49,50. When the crop maturity period is same for both crops in intercropping system, then the value of ATER is equal to LER. When the value of ATER is > 1, there is a yield advantage, when it is < 1, yield disadvantage and when ATER is 1, then there is no gain or loss in yield.
ATER = 1/t [{(d okra × Yi okra)/Ym okra] + [(d cowpea × Yi cowpea)/Ym cowpea}] (5)
Where, Yi = intercrop yield; Ym = mono crop yield; d = growth period of the crops in days; t = time in days for which field remained occupied.
Crop Competition Indices
Competition index (CI), relative crowding coefficient (RCC), and aggressivity index (A) were used to estimate the crop competition in the intercropping systems.
Competition Index (CI)
The Competition index (CI) compares the yield of a crop intercropping system over its monocropping system separately. CI is estimated based on unit area basis and resembles the yield difference of a crop in intercropping system over its monocropping system (Equation 6). When the yield of crop in intercropping system is higher than its monocropping yield at unit area basis, the system is considered positive. But, when the yield is low in intercropping system over its monocropping, it is considered as negative effect and there will be a crop competition 51.
CI = {(Ym okra – Yi okra) × (Yi cowpea – Ym cowpea)}/(Ym okra × Yi okra) (6)
Where, Yi = intercrop yield; Ym = monocrop yield;
Relative Crowding Coefficient (RCC)
The relative crowding coefficient (RCC) measures the relative competitiveness of a crop in the intercropping system based on the yield and their occupied area 48. The RCC compares the yield of a crop in intercropping system over its monocropping system. The RCC for okra and cowpea are given in equations 7 and 8, respectively. The negative value indicates strong competitiveness whereas the positive value represents the weak competitiveness in the intercropping system. The value of RCC is > 1, equal 1, and < 1 represents the yield advantage, no advantage or disadvantage and yield disadvantage, respectively.
RCC okra = {Yi okra/(Ym okra – Yi okra)} × (Z cowpea/Z okra) (7)
RCC cowpea = {Yi cowpea/(Ym cowpea – Yi cowpea)} × (Z okra/Z cowpea) (8)
Where, Yi = intercrop yield; Ym = mono crop yield; Z = proportion of the land occupied by the crop
Aggressivity Index (Ai)
The aggressivity index (Ai) is an index of dominance, and it is used to estimate the competitive relationship in intercropping system 52. The Ai for okra and cowpea is given in equations 9 and 10, respectively. Zero value indicates that both crops are equally competitive. Positive sign represents that the crop is dominant, likewise, negative value indicates that crop is dominated by other crop.
Ai okra = {Yi okra/(Ym okra – Z okra)} – {Yi cowpea/(Ym cowpea – Z cowpea)} (9)
Ai cowpea = {Yi cowpea/(Ym cowpea – Z cowpea)} – {Yi okra/(Ym okra – Z okra)} (10)
Where, Yi = intercrop yield; Ym = monocrop yield; Z = proportion of the land occupied by the crop
Land Utility Efficiency Index
Multiple cropping index (MCI) was used to estimate the efficiency of land utilization. The MCI is the proportion of land area utilized by the crops in intercropping system to the total land area available for the cultivation. The MCI value is expressed in percentage 53. The high value of MCI indicates the efficient utilization of land in the intercropping system.
MCI = {(a okra + a cowpea)/At} × 100 (11)
Where, a = area occupied by the crop; At = total land area available for cultivation
Statistical Analysis
Analysis of variance test was performed in Statistical software SAS 9.1 and mean separation was done by using the least significance difference (LSD) method at p <0.05 and the standard error (SE) was calculated.
Results
We presented the results in three sections, such as the results obtained from the analysis of growth parameters, yield parameters, and cropping indices.
Growth Parameters
Plant Height
Fig. 2 shows the results of plant height in cm at 2–week intervals for okra and cowpea. The results show that there was an increasing trend in plant height with weeks. The okra height was not significantly differed among the treatments from 2–WAP to 8–WAP. The highest plant height of okra was (35.15 ± 2.87 cm) in T2 at 8–WAP. The plant height of cowpea was not significantly different at 2–WAP and 4–WAP. At 6–WAP, plant height of cowpea was significantly higher in T1 (19.00 ± 0.83 cm) and T2 (19.03 ± 1.00 cm) and these were not significantly different within them, whereas it was least significant in T3 (15.56 ± 2.27 cm). The plant height of cowpea was significantly higher in T2 (22.73 ± 0.78 cm) followed by T1 (21.40 ± 1.17 cm) and it was least significant in T3 (18.27 ± 0.81 cm) at 8–WAP.
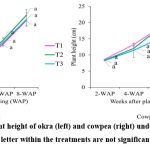 |
Figure 2: Average plant height of okra (left) and cowpea (right) under different treatments. Means with the same letter within the treatments are not significantly different at p=0.05. |
Number of Leaves
The results of the number of leaves per plant for okra and cowpea are represented in Fig. 3. The number of leaves in okra showed an increasing trend from 2–WAP to 8–WAP. The number of leaves in okra was not significant with weeks except at 6–WAP where T2 (14.33 ± 0.88) had a higher number of leaves. The highest number of okra leaves was observed in T3 (21.67 ± 0.88) at 8–WAP. In cowpea, the number of leaves increased from 2–WAP to 6–WAP and there was a slight decline at 8–WAP. The number of cowpea leaves was not significantly different among the treatments with weeks. The highest number of leaves in cowpea was observed in T2 (22.67 ± 1.67) at 6–WAP.
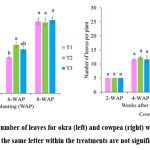 |
Figure 3: The average number of leaves for okra (left) and cowpea (right) with weeks under different treatments. Means with the same letter within the treatments are not significantly different at p=0.05. |
Number of Branches
The results of the number of branches at a 2–week interval is represented in Fig. 4. The number of branches was increased from 6–WAP to 8–WAP in both okra and cowpea. In okra, the number of branches was significantly high in T2 (3.47 ± 0.13) followed by T1 (3.07 ± 0.07), and it was least significant in T3 (2.70 ± 0.25) at 6–WAP. There was no significant difference in branch number within the treatment at 8–WAP, where the highest number was observed in T2 (5.13 ± 0.30). In cowpea, the number of branches was not significantly different among the treatments at both 6–WAP and 8–WAP and the highest number of branches was recorded in T3 (3.33 ± 0.33) at 8–WAP.
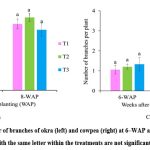 |
Figure 4: Average number of branches of okra (left) and cowpea (right) at 6–WAP and 8–WAP under different treatments. Means with the same letter within the treatments are not significantly different at p=0.05. |
Yield Parameters
The number of flowers for both okra and cowpea is represented in Fig. 5, while other yield parameters are given in Table 4 for okra and Table 5 for cowpea such as the number of pods per plant, pod yield, pod weight, pod length, pod circumference, and number of grains per pod.
The number of flowers in okra showed an increasing trend from 5–WAP to 7–WAP, and then, there was a slight reduction at 9–WAP. The number of flowers in okra was significantly high in T1 with weeks (Fig. 5). At 5–WAP, the number of flowers in okra was significantly high in T1 (2.10 ± 0.06) and it was least significant in both T2 (1.40 ± 0.06) and T3 (1.22 ± 0.06). Similar significant trend was recorded at 7–WAP and 9–WAP for number of okra flowers. The number of okra flowers was significantly high in T1 (5.80 ± 0.15) followed by T2 (4.23 ± 0.09), and it was least significant in T3 (3.47 ± 0.09) at 7–WAP. Similarly, it was significantly higher in T1 (5.55 ± 0.05) followed by T2 (4.14 ± 0.12) and least significant in T3 (3.58 ± 0.29) at 9–WAP. In cowpea, the number of flowers showed an increasing trend from 5–WAP to 6–WAP, and then, there was a decline at 7–WAP. The number of cowpea flowers was not significant within the treatments from 5–WAP to 7–WAP. The highest number of cowpea flowers was recorded in T3 (6.03 ± 0.09) at 6–WAP.
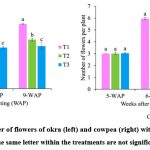 |
Figure 5: Average number of flowers of okra (left) and cowpea (right) with weeks under different treatments. Means with the same letter within the treatments are not significantly different at p=0.05 |
The number of pods per plant in okra was significantly higher in and T1 (13.25 ± 0.14) followed by T2 (9.54 ± 0.34), and it was least significant in T3 (8.09 ± 0.34) (Table 4). The number of pods per plant in cowpea was not significantly different among the treatment and the highest values was recorded in both T1 (9.00 ± 0.58) and T2 (9.00 ± 0.00) (Table 5). The pod yield in okra was significantly high in T1 (3.40 ± 0.02 t ha-1), followed by T2 (3.20 ± 0.05 t ha-1), and it was least significant in T3 (3.06 ± 0.03 t ha-1) (Table 4). The pod yield in cowpea was significantly high in both T1 (0.31 ± 0.01 t ha-1) and T2 (0.22 ± 0.01 t ha-1) and these were not significantly different within them where it was least significant in T3 (0.12 ± 0.00 t ha-1) (Table 5). The pod weight of okra was not significantly different among the treatments and the highest number was observed in T2 (36.67 ± 1.67 g) (Table 4). The number of grains per pod in cowpea was not significantly different and the highest number was recorded in T1 (13.67 ± 0.33) (Table 5). The grain yield in cowpea was significantly high in T2 (0.22 ± 0.01 t ha-1) followed by T1 (0.15 ± 0.01 t ha-1) and it was least significant in T3 (0.08 ± 0.00 t ha-1 (Table 5).
The pod length was not significantly different among the treatments in both okra and cowpea. The highest pod length was recorded for T1 in okra (19.53 ± 0.73 cm) and cowpea (13.67 ± 0.33 cm) (Table 4) (Table 5). The pod circumference of okra was not significantly different among the treatments and the highest value was observed in T1 (7.53 ± 0.37 cm) (Table 4).
Table 4: Results of the yield parameters of okra.
|
Treatments |
Number of pods per plant |
Pod yield (t ha-1) |
Weight per pod (g) |
Pod length (cm) |
Pod circumference (cm) |
|
T1 |
13.25 ± 0.14 (13.50–13.00) a |
3.40 ± 0.02 (3.42–3.37) a |
36.67 ± 1.67 (40–35) a |
19.53 ± 0.73 (20.50–18.10) A |
7.53 ± 0.37 (8.25–7.00) a |
|
T2 |
9.54 ± 0.34 (9.81–9.20) b |
3.20 ± 0.05 (3.28–3.10) b |
36.10 ± 3.09 (40–30) a |
18.9 ± 0.26 (19.40–18.50) A |
7.33 ± 0.09 (7.50–7.20) a |
|
T3 |
8.09 ± 0.34 (8.60–7.45) c |
3.06 ± 0.03 (3.12–3.02) c |
32.77 ± 1.47 (35–30) a |
19.13 ± 0.47 (20–18.40) A |
7.50 ± 0.15 (7.70–7.20) a |
means values are given with ± standard error (SE) and range (maximum-minimum); means with the same letter within the column are not significantly different at p=0.05.
Table 5: Results of the yield parameters of cowpea.
|
Treatments |
Number of pods per plant |
Pod yield (t ha-1) |
Grain yield (t ha-1) |
Number of grains per pod |
Pod length (cm) |
|
T1 |
9.00 ± 0.58 (10–8) a |
0.22 ± 0.01 (0.24–0.20) a |
0.15 ± 0.01 (0.16–0.14) b |
13.67 ± 0.33 (14–13) a |
16.98 ± 0.37 (17.57–16.30) A |
|
T2 |
8.67 ± 0.67 (10–8) a |
0.31 ± 0.01 (0.32–0.30) a |
0.22 ± 0.01 (0.23–0.20) a |
12.00 ± 0.58 (13–11) a |
16.20 ± 0.49 (17.10–15.40) A |
|
T3 |
9.00 ± 0.00 (9–9) a |
0.12 ± 0.00 (0.12–0.11) b |
0.08 ± 0.00 (0.08–0.08) c |
12.33 ± 0.33 (13–12) a |
16.17 ± 0.12 (16.40–16.00) A |
means values are given with ± standard error (SE) and range (maximum-minimum); means with the same letter within the column are not significantly different at p=0.05.
Cropping Indices
The results of cropping indices are represented in Table 6. For the estimation of cropping indices, yield of the intercropping systems was evaluated using monocropping yield. The average yield of okra and cowpea in monocropping system was 4.54 ± 0.03 t ha-1 and 1.03 ± 0.02 t ha-1, respectively.
Yield Efficiency Idices
Harvest index (HI) was not significantly different among the treatments. However, okra had a higher HI value (0.44 – 0.50) than cowpea (0.12 – 0.21). The highest land equivalent ratio (LER) was recorded significantly in T3 (1.002) followed by T2 (0.922), and it was least significant in T1 (0.851). Based on LER, a slight yield advantage was recorded in T3 (0.2 %), and a yield disadvantage was recorded for in T2 (7.8 %) and T1 (14.9 %). Significantly, the highest relative yield total (RYT) was recorded for T3 (1.042) followed by T2 (0.959), and it was least significant in T1 (0.873). Based on RYT, yield advantage was recorded in T3 (4.2 %), whereas yield disadvantages were recorded in T2 (4.1%) and T1 (12.7 %). The area time equivalent ratio (ATER) was less than one in all intercropping systems. The highest ATER was recorded significantly in T3 (0.954), followed by T2 (0.878) and it was least significant in T1 (0.802). Based on the ATER, all okra–cowpea intercropping systems had yield disadvantage and it was 4.6 %, 12.22 %, and 19.8 % in T3, T2 and T1, respectively.
Competition Indices
The competition index (CI) was significantly higher in T1 (8.421), followed by T2 (5.867) and it was least significant in T3 (3.018). All treatments had a positive value for CI (> 0). The Relative crowding coefficient (RCC) of okra was significantly high in T3 (1.089) followed by T2 (0.758) and it was least significant in T1 (0.481). The RCC of cowpea was significantly high in T1 (1.131) followed by T2 (1.106) and it was least significant in T3 (0.952). The value of RCC in okra was > 1 in T3, and < 1 in T1 and T2. The value of RCC in cowpea was <1 in T3 and >1 in T1 and T2. The cowpea had had a positive aggressive index (Ai) value in all treatments, while it was negative value for okra.
Land Utilization Efficiency Indices
The multiple cropping index (MCI) was 98.35 %, 96.3 %, and 95.06 %, in T3, T2, and T1, respectively, and had not statistically different within them.
Table 6: Results of the cropping indices with the treatments
|
Treatment |
HI okra |
HI cowpea |
LER |
RYT |
ATER |
CI |
RCC okra |
RCC cowpea |
Ai okra |
Ai cowpea |
MCI |
|
T1 |
0.479 a |
0.157 a |
0.851 c |
0.873 c |
0.802 c |
8.421 a |
0.481 c |
1.131 a |
-0.003 A |
0.003 a |
96.30% |
|
T2 |
0.499 a |
0.202 a |
0.922 b |
0.959 b |
0.878 b |
5.867 ab |
0.758 ab |
1.106 b |
-0.000 B |
0.001 b |
95.06% |
|
T3 |
0.468 a |
0.213 a |
1.002 a |
1.042 a |
0.954 a |
3.018 c |
1.089 a |
0.952 c |
-0.000 B |
0.001 b |
98.35% |
means with the same letter within the column are not significantly different at p=0.05.
Discussion
Selection of Cropping Systems and Design
In this study, we established the okra–cowpea intercropping systems (T1, T2 and T3). In addition to the intercropping systems, we established the monocropping of okra and cowpea for the use of cropping indices. The land, irrigation, and rainfall, availability of labour, and capital resources determine the type of cropping systems practiced in an area 54–56. The primary goal of intercropping is to increase yield over a pure stand on the same amount of land over a specific period 13. The crop competition often happed in any intercropping system when the component crops are not providing complementary effects 57. Due to competitive, complementary, or facilitative interactions, intercropping grain legumes with other crops has the potential to increase the use efficiency of nitrogen sources 58. Therefore, we selected the okra and cowpea from vegetable and grain legumes, respectively to design the different intercropping systems and we ensured the optimum space for each crop during the design of each treatment to minimize the competition. The combination of okra and cowpea intercropping system has been practiced due to many beneficial effects 59, including risk reduction through crop failure insurance, better resource utilization by crops with varying heights, rooting depths, and nutrient requirements 18,60. Cowpea is a most important crops in fulfilling many roles among the various leguminous plants 25. Several patterns were designed for okra cowpea intercropping system in previous studies 61, 62. However, in this study we used the three mostly used cropping patterns for okra–cowpea intercropping systems for the evaluation.
Our focus was to explore the use of cropping indices, therefore, in this study, soil nutrient and plant nutrient analysis was not studied. However, we measured the chlorophyll content in each crop from 2–WAP to 8–WAP (Fig. 6). The chlorophyll content in the crops is affected by available nitrogen and environmental stresses 63. The chlorophyll content was not significantly different among the treatments in cowpea. Similarly, the chlorophyll content was not significantly different among the treatments in okra except this was significantly high in T1 and T2 at 6–WAP. Therefore, we assumed that the effect of nodulation or ability of Nitrogen provision did not affect the treatments. However, the chlorophyll content was high at 6–WAP for both okra and cowpea. It may be correlated to growth stages.
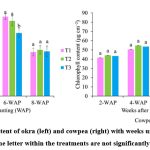 |
Figure 6: Chlorophyll content of okra (left) and cowpea (right) with weeks under different treatments. Means with the same letter within the treatments are not significantly different at p=0.05 |
Growth Parameters
We assessed the plant height, number of leaves and number of branches as growth parameters for okra and cowpea. The growth characteristics of the crops is dependent on the selection of intercropping system 14,64. Plant height of okra was significantly different with different patterns of okra–cowpea intercropping whereas the plant height of cowpea was not significantly different 62. Our plant height value was higher, and the leave number was consistent with the value of previous study, similarly, in the same study, plant height and leave number were 17.78–31.13 cm and 7–11.25, respectively in okra whereas these were 9.18–55.03 cm, 17.25–27 in cowpea in okra–cowpea intercropping system, however, they used different varieties of okra and cowpea 61. The number of leaves is an important growth parameter, which is affected by genetic and environmental factors. The no significant different observed for number of leaves in okra–cowpea intercropping in 2–8 WAP except in 6–WAP 62. This was consistent with our study, the number of leaves was not significantly different for both okra and cowpea except for okra at 6–WAP. In a previous study, there was an increasing trend of pod number with the increased branch number, but crop yield was decreased with the increased branch number. They also found that yield was increased with branch number at initial and then plateaued 65.
Based on the growth parameters, T2 was provided the significantly higher plant height for cowpea, whereas number of leaves and branch number were not significant. For okra, the number of leaves and branches were significantly high in T2, whereas plant height was not significantly different. It may be due to the high number of cowpea population in T2 than okra. Based on the growth characteristics of both okra and cowpea, comparatively T2 was performed well.
Yield Parameters
For yield parameters, number of flowers, number of pods, number of grains, average pod weight, grain yield, number of grains per pod, pod length and circumference were assessed. Among the yield parameters, fresh pod weight was measured for okra as it is marketable yield, while dry pod weight was measured for cowpea as it is the marketable yield. There was a huge difference in heritabilities between intercrop over monocrop 66. In our study the number of flowers in cowpea was not significantly different among the treatments with weeks, however, it was significantly high in T1 for okra. The number of pods in okra was high in T2 whereas it was not significant in cowpea. The number of pods in okra were consistent with 59, who found that weight per pod ranged from 12 to 16, but weight per pod was lower (11.87–15.06 g) than our value (32.77–36.77 g). However, pod yield of okra (6.58–8.89 t ha-1) and grain yield of cowpea (3.54–7.19 t ha-1) were higher than our value in okra. There was a huge difference in heritabilities between intercrop over monocrop cowpea intercropping systems (Table 4; Table 5), this was due to varietal characteristics. Our pod yield of okra (3.06–3.4 t ha-1) was higher in a study 61, the value from 0.26–1.88 t ha-1, similarly, our pod yield of cowpea (0.12–0.31 t ha-1) was lower than the same study 61 that pod yield cowpea ranged from 0.65 to 2.68 t ha-1 in under okra–cowpea intercropping. In this study, monocropping yield of okra (4.54 ± 0.03 t ha-1) and cowpea (1.03 ± 0.02 t ha-1) was lower than the recommended yield of okra (10–15 t ha-1) and cowpea (1.6 t ha-1), this may be attributed to specific location of the study area, water stress during the research period, pest, and disease infection. However, our monocropping and intercropping yield was comparable with previous study in this region 61, 62. Fruit quality is crucial to marketability and is primarily correlated with the distinctive pod length 67. In this study, pod length was not significantly different among the treatments for both okra and cowpea. For pod length, the average values of cowpea genotypes ranged from 10.90 to 29.87 cm 68, our value of pod length for cowpea ranged from 16. 2 to 17.67 cm. Pod length is one of several agronomic characteristics that are linked to grain yield in cowpea. In our study, cowpea grain yield was significantly low in T3. Single row of okra with single row of cowpea gave the highest yield in the intercropping system 69. This result was consistent with our study and pod yield was significantly high in single row of okra with single row of cowpea (T1). 61 and single row of okra with double–row of cowpea showed a high growth and yield performance with a combination of fertilizer treatments in the intercropping system. In this study, it is consistent with cowpea grain yield, and it was significantly high in single row of okra with a double–row of cowpea (T2) 61.
Based on the yield parameters, T1 was a suitable combination of intercropping system for okra pod yield whereas T2 was suitable for number of flowers and number of branches. In cowpea, T2 was a suitable combination of intercropping system for grain yield, whereas other yield parameters were not significant. Comparatively, the results of yield parameters were closely related to growth parameters in both okra and cowpea intercropping systems.
Cropping Indices
In this study, the efficiency of intercropping systems was explained by different cropping indices including yield–based, competition–based and land area–based. The efficacy was determined based on what type of indices were used. The harvest index (HI) was influenced by genotypes, environment, and crop management practices 70,71. In our study, we used the same variety of okra and cowpea for all cropping systems in the same environment where all the agronomic management practices were done according to the recommendation. Therefore, the HI index of the okra and cowpea was not significantly changed among the treatments. The HI values for okra in our study ranged from 0.4 to 0.5 and this value was within the range of the most intensively farmed cereals (0.44–0.6) 43. Similarly, the HI value for the cowpea ranged from 0.2 to 0.5 72,73, whereas our value was closer to the minimum (0.12–0.21). This may be due to the varietal characteristics of each crop. This result showed that the proportion of economic yield to the total biological yield was higher in okra than cowpea.
There is no difference in the yield between intercrop and monocrop when LER, RYT and ATER has a value of 1 74, whereas > 1 represents the yield advantages. In our study, yield advantage was observed in T3 based on LER and RYT. This finding agreed with 75, who the reported that the value of LER was > 1 in okra and cowpea intercropping. The LER value of 1.1 and 1.48 for single row of okra with single row of cowpea and double–row of okra with single row of cowpea, but our value was < 1 for those, this may be due to the different spacing and varieties used 69. The LER value ranged from 1.14 to 2.71 in okra–cowpea intercropping 59,76. The yield advantages demonstrated with okra–cowpea intercrops were referable to the soil Nitrogen economy often associated with the inclusion of legumes in the mixture 58. The LER value is limited to unit land area, and it doesn’t consider the unit area population. Therefore, we applied the RYT to determine the efficiency in more explainable.
The selection of crops in the intercropping system, such as the intercrops crop combination, has an impact on yield and yield components at different densities 77. It was clearly noted that based on the RYT, when maintaining the population density in both monocropping and intercropping, under intercropping systems yield advantage was high in every intercropping system 64. However, the crop competition will lower the RYT in the intercropping system. Thus, the RYT value of < 1 indicates fierce competition 78. In our study, RYT was > 1 for in T3 indicating that there was a yield advantage. However, the ATER is the most effective way to estimate the yield advantage because this index is based on crop maturity periods of the intercrops and long duration of the intercrop than LER and RYT which only deal with yield. In our study, the ATER was < 1 for all treatments which indicated there is no yield advantage when duration of intercrops included in the estimation. The ATER value ranging from 1.25 to 2.66 in okra–cowpea intercropping, and the okra with a double–row and cowpea with three–row recommended as a good combination 62.
Based on the competition index (CI), all treatments had a positive value (> 1) and these results showed that there was no competition between okra and cowpea in all intercropping systems. Value of the RCC was also >1 among the treatment for both crops, this also further accurately ensure, there was no crop competition between okra and cowpea in intercropping systems. The cowpea had a positive Ai value whereas okra had negative value and this result showed that cowpea was a dominant crop in the intercropping systems while okra was dominated by cowpea. The results of MCI showed that the land was utilized with higher efficiency (>95 %) (Table 6).
The limitation of our study is in our focus solely on the application of cropping indices for evaluating okra–cowpea intercropping systems, neglecting soil characteristic measurements such as soil nutrients. Future research should prioritize soil analysis to provide valuable insights into the growth and yield performance of intercropping systems. Additionally, while we aimed to assess intercropping systems primarily through growth and yield performance, we acknowledge the potential influence of other factors such as nodulation of legumes and root mycorrhization 79, which were not directly measured in this study. Moreover, our evaluation criteria were limited to yield efficiency, competition indices, and land utilization indices, overlooking economic indices 80 that could further inform intercropping system selection 30. Furthermore, our experimental trial was conducted over a single season, potentially limiting the generalizability of our findings. Future studies should consider long–term trials across multiple seasons and locations, encompassing a broader range of intercropping patterns, to more comprehensively evaluate the sustainability of okra–cowpea intercropping systems using cropping indices for management practices.
Conclusion
In this study, we evaluated okra–cowpea intercropping systems using both growth and yield performance and cropping indices. The outcomes differed between these two approaches. While growth and yield analysis selected single row okra with single row cowpea (T1) and single row okra with double–row cowpea (T2), cropping indices identified double–row okra with single row cowpea (T3) as the most suitable combination. T3 not only demonstrated a yield advantage but also exhibited minimal crop competition and maximal land utilization across all intercropping systems. Cowpea emerged as the dominant crop in the intercropping systems. By considering factors like unit area land, population, relative crowding, aggressivity, and crop maturity, cropping indices offered a more strength in assessment for selection of suitable intercropping system. This underscores the importance of supplementing growth and yield analysis with cropping indices for evaluating intercropping efficiency. Therefore, we recommend prioritizing the application of cropping indices over the growth and yield alone when selecting intercropping systems for optimal agricultural productivity.
Acknowledgment
This experiment was carried out at the Crop Farm of the Faculty of Agriculture, University of Jaffna, Sri Lanka. The authors would like to express sincere appreciation to the staff of the Crop Farm and Department of Agronomy, Faculty of Agriculture, University of Jaffna for facilitating the research and providing the necessary Farm Machinery and provisioning Laboratory facilities.
Funding Sources
The author(s) received no financial support for the research, authorship, and/or publication of the article.
Conflict of Interest
The authors declare that there are no conflicts of interest.
Data Availability Statement
The data collected from the field are available on request from the corresponding author.
Informed Consent Statement
This research did not involve human participants, animal, subjects, or any material that requires ethical approval.
Authors’ Contribution
K.A. (Kirisha Arumugasamy): conceptualization and design of the study, wrote the manuscript and design figures and tables.
J.K. (Jeyavanan Karthigesu): Editing and revising of manuscript.
S.S. (Sritharan Sinnamani): Field guidance, designs and farm facilities for experimental work.
References
- Zeifman L, Hertog S., Kantorova V., Wilmoth J. A World of 8 Billion; 2022. United Nation Department of Economic and Social Affairs: 1–4. Accessed October 13, 2023.
- United Nations Department of Economic and Social Affairs, Population Division. Global Population Growth and Sustainable Development, 2021, UN DESA/POP/2021/TR/NO. 2.
- Ray DK, Mueller ND, West PC, Foley JA. Yield Trends Are Insufficient to Double Global Crop Production by 2050. PLoS One. 2013;8(6):e66428. doi:10.1371/journal.pone.0066428
CrossRef - FAO. The Future of Food and Agriculture-Trends and Challenges; 2017. Rome. https://openknowledge.fao.org/server/api/core/bitstreams/2e90c833-8e84-46f2-a675-ea2d7afa4e24/content
- Yu T, Mahe L, Li Y, Wei X, Deng X, Zhang D. Benefits of Crop Rotation on Climate Resilience and Its Prospects in China. Agronomy. 2022;12(2):436. doi:10.3390/agronomy12020436
CrossRef - Odedina JN, Fabunmi TO, Adigbo SO, Odedina SA, Kolawole RO. Evaluation of cowpea varieties (Vigna unguiculata, L Walp) for intercropping with okra (Abelmoschus esculenta, L Moench). Am J Res Commun. 2014;2(2):91-108.
- Altieri MA, Nicholls CI, Henao A, Lana MA. Agroecology and the design of climate change-resilient farming systems. Agron Sustain Dev. 2015;35(3):869-890. doi:10.1007/s13593-015-0285-2
CrossRef - Maitra S, Ghosh DC, Sounda G, Jana PK. Performance of intercropping legumes in finger millet (Eleusine coracana) at varying fertility levels. Indian Journal of Agronomy. 2001;46(1):38-44.
CrossRef - Beckage B, Gross LJ. Overyielding and species diversity: what should we expect? New Phytologist. 2006;172(1):140-148. doi:10.1111/j.1469-8137.2006.01817.x
CrossRef - Makinde AI, Oyekale KO, Daramola DS. Growth and yield of okra (Abelmoschus esculentus L. Moench) as influenced by fertilizer application under different cropping systems. Agricultural Social Economic Journal. 2022;22(1):29-36. doi:10.21776/ub.agrise.2022.022.1.5
CrossRef - Banik P. Evaluation of Wheat (Triticum aestivum) and Legume Intercropping Under 1:1 and 2:1 Row-replacement Series System. J Agron Crop Sci. 1996;176(5):289-294. doi:10.1111/j.1439-037X.1996.tb00473.x
CrossRef - Usman SD. Seed production and quality of okra as affected by sowing time. Seed Research. 2001;29(1):47-51.
- Caballero R, Goicoechea EL, Hernaiz PJ. Forage yields and quality of common vetch and oat sown at varying seeding ratios and seeding rates of vetch. Field Crops Res. 1995;41(2):135-140. doi:10.1016/0378-4290(94)00114-R
CrossRef - Maitra S, Hossain A, Brestic M, et al. Intercropping—A Low Input Agricultural Strategy for Food and Environmental Security. Agronomy. 2021;11(2):343. doi:10.3390/agronomy11020343
CrossRef - Huss CP, Holmes KD, Blubaugh CK. Benefits and Risks of Intercropping for Crop Resilience and Pest Management. J Econ Entomol. 2022;115(5):1350-1362. doi:10.1093/jee/toac045
CrossRef - Liu Z, Nan Z wu, Lin S ming, et al. Millet/peanut intercropping at a moderate N rate increases crop productivity and N use efficiency, as well as economic benefits, under rain-fed conditions. J Integr Agric. 2023;22(3):738-751. doi:10.1016/j.jia.2022.08.078
CrossRef - Li S, Evers JB, van der Werf W, et al. Plant architectural responses in simultaneous maize/soybean strip intercropping do not lead to a yield advantage. Annals of Applied Biology. 2020;177(2):195-210. doi:10.1111/aab.12610
CrossRef - Susan AJ, Mini C. Biological efficiency of intercropping in okra (Abelmoschus esculentus, L. Moench). J Trop Agric. 2005;43(1-2):33-36.
- Ren J, Zhang L, Duan Y, et al. Intercropping potato (Solanum tuberosum L.) with hairy vetch (Vicia villosa) increases water use efficiency in dry conditions. Field Crops Res. 2019;240:168-176. doi:10.1016/j.fcr.2018.12.002
CrossRef - Evers JB, van der Werf W, Stomph TJ, Bastiaans L, Anten NPR. Understanding and optimizing species mixtures using functional–structural plant modelling. J Exp Bot. 2019;70(9):2381-2388. doi:10.1093/jxb/ery288
CrossRef - Duchene O, Vian JF, Celette F. Intercropping with legume for agroecological cropping systems: Complementarity and facilitation processes and the importance of soil microorganisms. A review. Agric Ecosyst Environ. 2017;240:148-161. doi:10.1016/j.agee.2017.02.019
CrossRef - Ndunguru J, Rajabu AC. Effect of okra mosaic virus disease on the above-ground morphological yield components of okra in Tanzania. Sci Hortic. 2004;99(3-4):225-235. doi:10.1016/S0304-4238(03)00108-0
CrossRef - Naveed A, Khan AA, Khan IA. Generation mean analysis of water stress tolerance in okra (Abelmoschus esculentus L.). Pak J Bot. 2009;41:195-205.
- Horn LN, Shimelis H. Production constraints and breeding approaches for cowpea improvement for drought prone agro-ecologies in Sub-Saharan Africa. Annals of Agricultural Sciences. 2020;65(1):83-91. doi:10.1016/j.aoas.2020.03.002
CrossRef - Boukar O. Cowpea Yield Evaluation Trials – Burundi.; 2008. Accessed October 14, 2023. https://doi.org/10.25502/20180918/1711/BO
- Weigelt A, Jolliffe P. Indices of plant competition. Journal of Ecology. 2003;91(5):707-720. doi:10.1046/j.1365-2745.2003.00805.x
CrossRef - Doubi BTS, Kouassi KI, Kouakou KL, Koffi KK, Baudoin JP, Zoro BIA. Existing competitive indices in the intercropping system of Manihot esculenta Crantz and Lagenaria siceraria (Molina) Standley. J Plant Interact. 2016;11(1):178-185. doi:10.1080/17429145.2016.1266042
CrossRef - Mohammed EMA, Meawad AA, Elesawy AE, Abdelkader MAI. Maximizing land utilization efficiency and competitive indices of roselle and cluster bean plants by intercropping pattern and foliar spray with lithovit. Saudi J Biol Sci. 2022;29(4):2886-2891. doi:10.1016/j.sjbs.2022.01.026
CrossRef - Verma K, Singh AK, Singh S. Assessing the suitability of traditional food crops and resource use efficiency in kalmegh [Andrographis paniculata (Burm. F.) Wall ex. Nees] based intercropping systems. Ind Crops Prod. 2023;203:117203. doi:10.1016/j.indcrop.2023.117203
CrossRef - Gitari HI, Nyawade SO, Kamau S, et al. Revisiting intercropping indices with respect to potato-legume intercropping systems. Field Crops Res. 2020;258:107957. doi:10.1016/j.fcr.2020.107957
CrossRef - Department of Census and Statistics. District Statistical Handbook.; 2022. Accessed October 13, 2023. Department of Census and Statistics. http://www.statistics.gov.lk/ref/HandbookDictionary# gsc.tab=0
- Northern Provincial Council. Statistical Information.; 2022. Accessed October 13, 2023. https://np.gov.lk/statistical-information-2021/
- Department of Agriculture Sri Lanka. Crops. https://doa.gov.lk/crops/. Accessed October 13, 2023. https://doa.gov.lk/crops/
- Ajayi E, Okonji C, Ayanlola O, Olofintoye T, Oyelowo D. Improving the growth and yield of okra by intercropping with varying populations of legumes. Journal of Agricultural Sciences, Belgrade. 2020;65(3):213-224. doi:10.2298/JAS2003213A
CrossRef - Nath P. Vegetable for the Tropical Regions. Indian Council for Agricultural Research; 1976.
- Tripathi KK, Govila OP. Biology of Abelmoschus Esculentus L. Okra. Government of India; 2011. Accessed October 13, 2023. http://www.geacindia.gov.in/resource-documents/biosafety-regulations/resource-documents/Biology_of_Okra.pdf
- Ajetomobi J, Abiodun A. Climate change impacts on cowpea productivity in Nigeria. African Journal of Food, Agriculture, Nutrition and Development. 2010;10(3). doi:10.4314/ajfand.v10i3.54082
CrossRef - Kumar N. Role of Balanced Fertilization for Horticultural Crop. Tamil Nadu Agricultural University; 2007. Accessed October 13, 2023. https://www.ipipotash.org/uploads/udocs/Manual-on-Horticulture.pdf
- Johnson LK, Dunning RD, Gunter CC, Dara Bloom J, Boyette MD, Creamer NG. Field measurement in vegetable crops indicates need for reevaluation of on-farm food loss estimates in North America. Agric Syst. 2018;167:136-142. doi:10.1016/j.agsy.2018.09.008
CrossRef - Mobolade AJ, Bunindro N, Sahoo D, Rajashekar Y. Traditional methods of food grains preservation and storage in Nigeria and India. Annals of Agricultural Sciences. 2019;64(2):196-205. doi:10.1016/j.aoas.2019.12.003
CrossRef - Ashadu N, Melvin SG, Fayia AK, Alieu MB. Growth and yield response of okra (Ablemochus esculentus) to varying rates of different sources of organic soil amendments at Njala, Moyamba District, Southern Sierra Leone. Afr J Agric Res. 2021;17(8):1144-1154. doi:10.5897/AJAR2021.15656
CrossRef - Donald CM, Hamblin J. The Biological Yield and Harvest Index of Cereals as Agronomic and Plant Breeding Criteria. In:; 1976:361-405. doi:10.1016/S0065-2113(08)60559-3
CrossRef - Hay RKM. Harvest index: a review of its use in plant breeding and crop physiology. Annals of Applied Biology. 1995;126(1):197-216. doi:10.1111/j.1744-7348.1995.tb05015.x
CrossRef - Mead R, Willey RW. The Concept of a ‘Land Equivalent Ratio’ and Advantages in Yields from Intercropping. Exp Agric. 1980;16(3):217-228. doi:10.1017/S0014479700010978
CrossRef - Zhang J, Smith DL, Li W, Chen X, Yang W. Effects of shade and drought stress on soybean hormones and yield of main-stem and branch. Afr J Biotechnol. 2011;10(65):14392-14398. doi:10.5897/AJB11.2143
CrossRef - van den Bergh JP, Elberse WTh. Yields of Monocultures and Mixtures of Two Grass Species Differing in Growth Habit. J Appl Ecol. 1970;7(2):311. doi:10.2307/2401382
CrossRef - Van den Bergh JP. An analysis of yields of grasses in mixed and pure stands. Agric.res.rep. 1968;714:71.
- De Wit CT. On competition, No. 66.8. Pudoc, Wageningen. 1960.
- Hiebsch CK, McCollum RE. Area‐×‐Time Equivalency Ratio: A Method for Evaluating the Productivity Of Intercrops. Agron J. 1987;79(1):15-22. doi:10.2134/agronj1987.00021962007900010004x
CrossRef - Yahuza I. Review of some methods of calculating intercrop efficiencies with particular reference to the estimates of intercrop benefits in wheat/faba bean system. Int J Biosci. 2011;1(5):18-30.
- Donald CM. Competition Among Crop and Pasture Plants. In: ; 1963:1-118. doi:10.1016/S0065-2113(08)60397-1
CrossRef - McGilchrist CA. Analysis of competition experiments. Biometrics. 1965:975-985.
CrossRef - Dalrymple DG. Survey of Multiple Cropping in Less Developed Nations. Economic Research Service; 1971.
- Chatterjee BN, Mati S, Mandal BN. Cropping Systems—Theory and Practice. 2nd ed. Oxford and IBH Publishing; 1989.
- Jew EKK, Whitfield S, Dougill AJ, Mkwambisi DD, Steward P. Farming systems and Conservation Agriculture: Technology, structures and agency in Malawi. Land use policy. 2020;95:104612. doi:10.1016/j.landusepol.2020.104612
CrossRef - Mahabal R. High Yielding Varieties of Crops. Oxford and IBH publishing Co.; 1980.
- Willey RW. Intercropping—It’s Important and Research Needs. Part 1. Competition and Yield Advantages. Field Crop Abstracts. 1979;32:1-10.
- Fatokun CA. Challenges and opportunities for enhancing sustainable cowpea production. Published online 2002.
- Ajayi E, Adeoye I, Shittu O. Economic analysis of intercropping okra with legumes. Journal of Agricultural Sciences, Belgrade. 2017;62(2):193-202. doi:10.2298/JAS1702193A
CrossRef - Okpara DA, Awurum AN, Okeke AI. Effect of planting schedule and density on cowpea/maize intercropping in southeastern Nigeria. J Sustain Trop Agric Res. 2004;11:59-67.
- Jayasinghe TSI, Sutharsan S, Srikrishnah S. Effect of Different Planting Geometry and Application of Liquid Organic Fertilizer On The Growth And Yield of Abelmoschus Esculentus L. Intercropped With Vigna Unguiculata L. International Journal of Scientific and Technology Research. 2019;8(12):1310-1314. Accessed October 14, 2023.
- Maduwanthi A, Karunarathna B. Spatial Arrangements on Growth and Yield of Cowpea (Vigna unguiculata L. Walp.) in Intercropping. Sabaragamuwa University Journal. 2020;18 (1): 66-78.
CrossRef - Zhang J, Blackmer AM, Ellsworth JW, Koehler KJ. Sensitivity of Chlorophyll Meters for Diagnosing Nitrogen Deficiencies of Corn in Production Agriculture. Agron J. 2008;100(3):543-550. doi:10.2134/agronj2006.0153
CrossRef - Willey RW. Evaluation and Presentation of Intercropping Advantages. Exp Agric. 1985;21(2):119-133. doi:10.1017/S0014479700012400
CrossRef - Xu C, Li R, Song W, et al. Responses of Branch Number and Yield Component of Soybean Cultivars Tested in Different Planting Densities. Agriculture. 2021;11(1):69. doi:10.3390/agriculture11010069
CrossRef - Zimmermann MJO, Rosielle AA, Waines JG, Foster KW. A heritability and correlation study of grain yield, yield components, and harvest index of common bean in sole crop and intercrop. Field Crops Res. 1984;9:109-118. doi:10.1016/0378-4290(84)90017-0
CrossRef - Olivera DF, Mugridge A, Chaves AR, Mascheroni RH, Viña SZ. Quality Attributes of Okra (Abelmoschus esculentus L. Moench) Pods as Affected by Cultivar and Fruit Size. J Food Res. 2012;1(4):224. doi:10.5539/jfr.v1n4p224
CrossRef - Peksen A. Fresh Pod Yield and Some Pod Characteristics of Cowpea (Vigna unguiculata L. Walp.) Genotypes from Turkey. Asian J Plant Sci. 2004;3(3):269-273. doi:10.3923/ajps.2004.269.273
CrossRef - Regmi S, Paudel M, Kunwar S. Evaluation of intercropping efficiency and profitability on Okra-Cowpea based cropping system in Chitwan district, Nepal. International journal of Horticulture, Agriculture and Food science. 2020;3(6):358-363. doi:10.22161/ijhaf.3.61.6
CrossRef - Porker K, Straight M, Hunt JR. Evaluation of G × E × M Interactions to Increase Harvest Index and Yield of Early Sown Wheat. Front Plant Sci. 2020;11. doi:10.3389/fpls.2020.00994
CrossRef - Hatfield JL, Walthall CL. Meeting Global Food Needs: Realizing the Potential via Genetics × Environment × Management Interactions. Agron J. 2015;107(4):1215-1226. doi:10.2134/agronj15.0076
CrossRef - Abdou S. Evaluation of cowpea [Vigna unguiculata (L) Walp.] lines for high grain and fodder yields in the dry season of Niger republic. Heliyon. 2022;8(3):e09147. doi:10.1016/j.heliyon.2022.e09147
CrossRef - Kwapata MB, Hall AE. Determinants of cowpea (Vigna unguiculata) seed yield at extremely high plant density. Field Crops Res. 1990;24(1-2):23-32. doi:10.1016/0378-4290(90)90019-8
CrossRef - Derebe B, Worku A, Chanie Y, Wolie A. On-farm participatory evaluation and selection of legumes intercropped with finger millet (Eleusine coracana L) in Western Amhara. Heliyon. 2021;7(11):e08319. doi:10.1016/j.heliyon.2021.e08319
CrossRef - Mady AAM, Mohammed FM, Mohammed HD, Emad-Elden FEE. Intra-row intercropping of cowpea and cucumber with okra as influenced by planting date of secondary crops. Assiut University Bulletin for Environmental Researches. 2007;10.1(10.1):13-33. doi:10.21608/auber.2007.150214
CrossRef - Maduwanthi AKMRB, Karunarathna B. Biological and Economic benefit of Okra (Abelmoschus esculentus L.) Cowpea (Vigna unguiculata L. Walp) Intercropping in Sandy Regosol. Middle East Journal of Agriculture Research. 2019;8(1):28-34.
- Waktola SK. Intercropping Soybean (Glycine max L. Merr.) at Different Population Densities with Maize (Zea mays L.) on Yield Component, Yield and System Productivity. Journal of Agricultural Economics, Extension and Rural Development. 2014;1:121-127.
- Baghdadi A, Halim RA, Othman R, Yusof MM, Atashgahi ARM. Productivity, relative yield and plant growth of forage corn intercropped with soybean under different crop combination ratio. Legume Research – An International Journal. 2016;(OF). doi:10.18805/lr.v0iOF.10755
CrossRef - Zhang W, Ahanbieke P, Wang BJ, et al. Temporal and spatial distribution of roots as affected by interspecific interactions in a young walnut/wheat alley cropping system in northwest China. Agroforestry Systems. 2015;89:327-343.
CrossRef - Ghosh PK. Growth, yield, competition and economics of groundnut/cereal fodder intercropping systems in the semi-arid tropics of India. Field Crops Res. 2004;88(2-3):227-237.
CrossRef