
Introduction
Maize is India’s third most important cereal crop after rice and wheat. India ranks fourth in maize cultivation area and seventh in production, representing around 4% of the world’s maize area and 2% of total production. During 2018-19, India’s maize cultivation area reached 9.2 million hectares. The annual output of maize in India is about 31.65 to 32.87 million metric tons, with a productivity of about 3.19 tons per hectare, slightly more than half the world average. However, the health and yield of this crucial crop are increasingly threatened by diseases such as Curvularia leaf spot, dwarf mosaic, grey leaf spot, northern leaf blight, round spot, rust southern leaf blight, and brown spot1. These diseases have become more prevalent due to shifts in cultivation systems, climatic changes, and pathogen evolution. In the face of these challenges, image processing techniques have emerged as a promising tool for disease identification. Among these, deep learning approaches have demonstrated superior performance to traditional machine learning methods. This thesis will delve into several deep learning strategies, including Multi-scale Convolution Neural 2 Network (MCNN), Bacterial Foraging Optimization (BFO) using Recurrent Neural Network (RNN), and Particle Swarm Optimization (PSO) using Convolution Neural Network (CNN). The novel Multi-scale CNN, which leverages Rectified Linear Units (ReLU) to preserve information in the output, will be explored for feature learning from training data. Additionally, an enhanced BFO will be employed for optimal weight assignment to RNNs, thereby enhancing the accuracy and speed of the network. This research aims to contribute to the field of computer science by advancing the application of deep learning and optimization algorithms in the context of agricultural disease identification and classification. The findings could enhance the resilience of maize crops, thereby securing global food supply chains.
Materials and Methods
The algorithms in the proposed work are successfully implemented using the MATLAB (Matrix Laboratories) 18b tool, which allows for the modelling and experimentation of the Plant Village dataset with various maize diseases. The performance of the proposed algorithms is tested using Leaf Blight, Leaf Spot, Common Rust and evaluated based on performance metrics such as Dice Coefficient, Sensitivity, Specificity, Jaccard Coefficient, F-Score, Accuracy, epochs and loss. In particular, the proposed algorithms IDMCSNN outperform EBFORNN and EBFORNN outperform IGPSOCNN concerning performance, accuracy and speed. Many methods have been developed for image segmentation, often combined with specific knowledge components for classification tasks. Many of these hierarchical techniques yield promising results through optimization. The boundary selection, either manual or automatic, is based on techniques that extract outlines from input images2. The uniformity of an input image can be determined based on pixel colour, intensity levels, and texture quality. These uniformity calculations aid image segmentation by dividing an image into regions or clusters corresponding to different objects or parts. Each pixel in an image plays a crucial role in the overall mechanism, particularly for large images, to facilitate segmentation.
Deep Learning Model
Deep learning has become increasingly prevalent in the agricultural sector, where it is often used to predict and classify diseases based on their symptoms and disease parameters. The complexity of disease management and the provision of appropriate predictive insights are crucial for controlling crop diseases. The adoption of deep learning techniques in agriculture has increased due to their effectiveness. In order to address the challenges mentioned above, it is essential to establish a novel framework that includes solutions for these difficulties. Deep learning involves data collection; data preparation, model training and evaluation, deployment, and monitoring images and videos from several sources are collected and then subjected to data preparation, which includes annotation and labeling. Preprocessing tasks such as transformations, resizing, and cropping are performed on the collected images3. Depending on the objective of the process, detection is conducted using image classification and segmentation during the model training and evaluation stages. Then, the model is set out with a user interface selection to measure scalable features. Monitoring and retraining of the model takes place with data selected for training. Following the acquisition of images, the initial step in an automatic plant disease detection system is pre-processing. This process encompasses colour conversion, noise filtering, and other enhancement methods. The system’s functionality is contingent upon the image quality procured for processing.
Shafi (2022) proposed an integrated system for detecting and diagnosing wheat rust disease4. The system converts the captured image into a History of executing/viewing/editing (HIS) format. The HIS format image is segmented using a Fuzzy Clustering Algorithm (FCA) that helps eliminate ambiguity and minimizes the objective functions. Shape and colour attributes are obtained using a co-occurrence matrix, and resulting features are trained through a Back Propagation Artificial Neural Network (BPANN) with 4 hidden layers.
Prasad et al. (2022) designed a multi-resolution mobile-based plant disease diagnosis system. This system uses two sets of datasets, mobile client images and pathology server mages with a resolution of 1600 x 1200 pixels [3]. The images used are Digital 3D Red, Green, Blue (RGB) colour images, isolated from the complex background. It is done by scanning the images with a constant dark or white background, preferably white. The collected images can show two types of diseases: leaf spot and leaf blotch. The RGB colour values are converted to luminance format. Enhancement is performed by denoising the image with multi-rate filters. Segmentation is performed on mobile devices using a K-Means clustering algorithm based on mobile feasibility. Gabor Wavelet Transform (GWT) fulfils the multi-resolution feature, combined with the Gray Level Co-occurrence Matrix (GLCM), to refine the feature vector. Then, the KNN algorithm is used to classify the selected features.
Chakravarthy& Raman (2020) proposed an automatic system to detect early blight disease in tomato plants. The images were collected from greenhouse crops with a resolution of 2592 x 1944. Colour Structure Descriptor (CSD) describes the occurrence of relevant colour from a single pixel and the whole spatial domain. To compute CSD, the image is applied with transformations such as Hue Maximum Minimum Difference (HMMD) and Scalable Colour Descriptor (SCD). A multi-scale representation of colour distribution is used to compute SCD. This image is again converted to HSV format. Colour Layout Descriptor (CLD) quantitatively describes colour pattern variation distributed in the image. The computed CLD image is converted into YCbCr format. These extracted colour features are processed using nested Leave One Out Cross Validation (LOOCV). LOOCV has two stages: the first performs colour description, and the second performs Classification.
Singh et al. (2020) proposed a plant disease detection system using Segmentation6. The system uses a clustering technique that combines the Genetic Algorithm and theK-Means Algorithm as a hybrid approach. Masked pixels are removed, and infected regions are picked inside within a specific boundary. K Cluster centres are calculated based on N-dimensional unlabelled points. Genetic Algorithm optimizes the clustering technique even on complex surfaces. It can generate multiple segmentations to pick up the best solution.
Sindhu and Sindhu(2019) proposed an intelligent system to detect Powdery Mildew spores in plant5. The same dataset of 155 images of multiple plants was used for testingThe reflective properties of images are captured under multiple lighting conditions. OTSU segmentation method sets the threshold automatically, and it can produce multiple thresholds on multiple regions. The highest peak is selected for further processing. Back Propagation Neural Network classifier classifies the healthy and diseased images.
Rastogi et al. (2015) developed a system to identify and grade leaf diseases using computer vision and fuzzy logic techniques4. The pre-processing steps consist of RGB colour conversion to grey images. Images are resized with pixel size, and the median filter performs denoising. Then, it is segmented using K-means segmentation, and segmented parts are used to calculate the features. The feature extraction method calculates contrast, energy, correlation, and homogeneity functions. The resultant features are trained using the ANN toolbox, and severity is estimated and graded using the Fuzzy Logic Technique for Leaf Scorch and Leaf Spot images7.
Dataset Descriptions
The datasets, composed of 36000 images with a count of 900 Leaf Blight, Leaf Spot, Common Rust, and healthy images, are uploaded in the MATLAB 18b editor window. Each class label is marked and attempts to predict the Leaf Blight or Leaf Spot Common Rust maize crop disease images from the dataset. The datasets are employed for training and testing the model. The binary response class variable takes 0 or 1, where 1 refers to positive and 0 refers to negative results. The fungal Leaf Blight in Maize occurs in humid regions, producing reddish spots forming large lesions8. Leaf Spot in maize is caused by fungal, bacterial or viral diseases during wet seasons. This is spread to leaves either by wind or due to heavy rain. Common Rust in maize is caused by a fungus, which creates orange-brown spores on both sides of leaves during cold seasons.
Performance Metrics
The performance of the proposed deep learning neural network algorithms for segmentation and classification has been evaluated using the parameters Dice Coefficient, Specificity, Sensitivity, Jaccard Coefficient, F-Score, and Accuracy.
Dice Coefficient
The Dice Coefficient is computed by generating discrepancies among segmented results of data. In addition, it is motivated to compute using True Positive (TP), False Positive (FP) and False Negative (FN) values for classification. It is denoted as

Sensitivity
Sensitivity is the measure of applicable instances between the images. More than the total instances relevant to those images have been recovered from the dataset. Sensitivity is the part of the recall measure that successfully classifies disease into exact classes. True Positive is the number of real positive occurrences in data, and False Negative is the number of real negative occurrences in the image.
Specificity
Specificity is determined as the percentage of True positives against both True and False Positive values for interpreted and actual features. It is determined as
Jaccard Coefficient
Jaccard Coefficient is computed to measure the similarity of features for classification. The formulation for the Jaccard Coefficient is represented as a ratio of intersection over the union of the A*B matrix. It is denoted as
![]()
F-Score
F-Score can merge precision and recall into a single measure that captures TP and TN properties. This is the harmonic mean of the two fractions, which is given by

Accuracy
Accuracy is the closeness of a calculated value to an actual value. Precision value is not dependent on accuracy and is given by
![]()
Equations 1 to 6 are used for calculating percentage improvements (increase or decrease) in Dice Coefficient, Sensitivity, Specificity, Jaccard Coefficient and Accuracy. During processing, a combination of 80 % training and 20% testing, 70 % training, 30% testing, 60% training and 40% testing of the data has been utilized in Fold validations. In the proposed work, two-fold validations have been applied for performance improvement during classification and segmentation. Fold 1 validation refers to first level iteration steps in which testing of the model takes place, and in the second fold, training of the model takes place. Then, if necessary, the process increases with folds to improve validations.
Results and Discussions
This research focuses on the segmentation and classification of diseases in maize leaves, conducted in the MATLAB environment. The primary objective of the proposed work is to identify diseases in the data files available in the Plant Village dataset. The performance evaluation metrics are based on three algorithms: the Improved Deep Multi-Scale Convolution Neural Network (IDMSCNN), the Enhanced Bacterial Foraging Optimized Recurrent Neural Network (EBFORNN), and the Improved Gaussian Particle Swarm Optimized Convolution Neural Network (IGPSOCNN). These algorithms aid in identifying maize plant diseases, such as Leaf Spot, Leaf Blight, and Common Rust, based on feature selection. Compared with traditional, modern approaches, the proposed methods are cross-validated using a two-fold validation approach. This involves several steps, including feature extraction and optimization. The reliability of the proposed framework is assessed by observing the results achieved using cross-validation techniques. A confusion matrix chart is utilized to understand the performance of a classification approach by presenting the predicted classes against the actual classes. In the context of IDMSCNN, EBFORNN, and IGPSOCNN, the confusion matrix provides insights into the network’s performance across different classes. This comprehensive analysis contributes to the ongoing efforts to improve disease detection in maize plants.
Performance Analysis of an Improved Deep Multi-Scale Convolution Neural Network (IDMSCNN)
Analysis using experimental metrics of the plant village dataset on the Improved Deep Multi-scale Convolution Neural Network has been carried out with the performance of Dice Coefficient, Sensitivity, Specificity, Jacquard Coefficient, and F-score. This is adopted for implementing and evaluating disease identification.
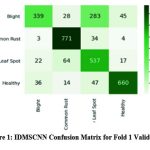 |
Figure 1: IDMSCNN Confusion Matrix for Fold 1 Validation |
Figure 1 depicts the confusion matrix for Fold 1 validation data. True Positive (TP) 339 instances were correctly predicted as leaf blight. In comparison, False Positive (FP) values of 28, 283 and 45 instances were predicted as leaf blight but belonged to common rust, leaf spot or healthy. False Negative (FN) of 3 common rust, 22 leaf spot and 36 instances of leaf blight are predicted. Remaining instances except first row and first column were predicted as True Negative (TN).Similarly, for Common Rust, Leaf Spot and healthy classes TP, FP, FN and TN represent the same concepts. TP values of Common Rust (771), leaf Spot (537) and healthy (660) are highlighted. The analysis of validation samples on IDMSCNN-based segmentation techniques has been evaluated based on the Dice Coefficient, Jaccard Coefficient, F-Score, Sensitivity and Specificity, illustrated in Table 1 for first fold validation data.
Table 1: IDMSCNN and 3D U-Net Comparison for Fold 1 Validation
|
Samples |
Technique |
DC |
Sensitivity |
Specificity |
JC |
F-Score |
|
Leaf Spot |
IDMSCNN |
99.78 |
98.12 |
99.89 |
99.84 |
99.12 |
|
3D- U Net |
98.51 |
93.36 |
98.53 |
98.45 |
98.14 |
|
|
Leaf Blight |
IDMSCNN |
99.65 |
98.14 |
99.71 |
99.24 |
99.51 |
|
3D- U Net |
98.42 |
93.89 |
98.89 |
98.06 |
98.32 |
|
|
Common Rust |
IDMSCNN |
99.56 |
96.15 |
99.65 |
99.40 |
99.23 |
|
3D- U Net |
98.36 |
97.99 |
98.41 |
98.42 |
98.74 |
On performance analysis, the proposed IDMSCNN performs better compared to 3D-U Net for Maize leaf disease segmentation and classification.
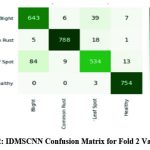 |
Figure 2: IDMSCNN Confusion Matrix for Fold 2 Validation |
The analysis of different folds of validation samples using IDMSCNN-based segmentation techniques has been evaluated. Figure 2 depicts the confusion matrix for Fold 2 validation data. True Positive (TP) 643 instances were correctly predicted as leaf blight. In comparison, False Positive (FP) values of 6, 39 and 7 instances were predicted as leaf blight but belonged to common rust, leaf spot or healthy. False Negative (FN) instances of 5 common rust, 84 Leaf spot and Zero healthy were predicted. Remaining instances except first row and first column represents True Negative. Similarly, for the Common Rust,Leaf Spot and healthy classes, TP, FP, FN and TN represent the same concepts. TP values of 788 common rust images, 534 leaf spot images, 754 healthy images, around 30000 images are highlighted. Dice Coefficient, Specificity, Sensitivity, Jaccard Coefficient and F-Score for Leaf Spot, Leaf Blight and Common Rust images from the Plant Village dataset are traced, and the percentage of improvement in increase or decrease is calculated using Equation (1) to Equation (6). Table 2 exemplifies the performance outcomes of the above metrics.
Table 2: IDMSCNN and 3D U-Net Comparison for Fold 2 Validation
|
Samples |
Technique |
DC |
Sensitivity |
Specificity |
JC |
F-Score |
|
Leaf Spot |
IDMSCNN |
99.83 |
98.54 |
99.27 |
99.76 |
99.21 |
|
3D- U Net |
98.61 |
93.63 |
98.78 |
98.18 |
98.19 |
|
|
Leaf Blight |
IDMSCNN |
99.38 |
98.62 |
99.59 |
99.20 |
99.48 |
|
3D- U Net |
98.42 |
93.89 |
98.89 |
98.06 |
98.32 |
|
|
Common Rust |
IDMSCNN |
99.60 |
97.55 |
99.58 |
99.46 |
99.31 |
|
3D- U Net |
98.87 |
93.12 |
98.58 |
98.66 |
98.79 |
Table 2 observes that proposed model IDMSCNN produce increased values during segmentation of plant disease regions produce higher values than existing 3D U-Net while uploading Leaf Spot, Leaf Blight and Common Rust images in Matlab Workspace.
The results shows the Dice Coefficient, Sensitivity, Specificity, Jaccard Coefficient and F Score comparison of proposed IDMSCNN with existing 3D-U Net. The metrics evaluated with IDMSCNN segmentation produce higher values by taking an average of Fold 1 and Fold 2 validation data. The proposed IDMSCNN takes 99.64% of the Dice Coefficient, 97.85% of Sensitivity, 99.62 % of Specificity, 99.48 % of the Jaccard Coefficient, and 99.31% of F Score as an average in Fold 1 and Fold 2 Validation. From Figure 7, it is evident that the above metrics improve in IDMSCNN compared with 3D-U Net. So, it is finally concluded the proposed IDMSCNN achieves better results than existing 3D-U Net when uploading different maize diseased in MATLAB workspace. It is computed based on the TP, TN, FP, and FN values of the confusion matrix for each data fold.
Performance Analysis of Enhanced Bacterial Foraging Optimized Recurrent Neural Network (EBFORNN)
Experimental analysis using the plant village dataset on the proposed model Enhanced Bacterial Foraging Optimized Recurrent Neural Network explains the performance in terms of Dice Coefficient, Sensitivity, Specificity, Jaccard Coefficient and F-Score, respectively, towards disease identification on the sample of maize crops.
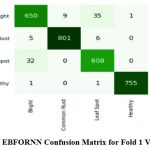 |
Figure 3: EBFORNN Confusion Matrix for Fold 1 Validation |
Figure 3 depicts the confusion matrix for the Fold 1 validation data among 30000 images. True Positive (TP) values of 650 instances were correctly predicted as leaf blight.
In comparison, False Positive (FP) value predictions of 9,35 and one instances were leaf blight but belonged to common rust, leaf spot or healthy. The value of 5 common rust, 32 leaf spot and one healthy False Negative (FN) instances were predicted. Remaining instances except first row and first column represents True Negative instances. Similarly, for Common Rust, Leaf Spot and healthy classes, TP, FP, FN and TN represent the concepts. TP values of 801 instances of common rust, 608 instances of Leaf spot, and 755 instances of healthy are highlighted.
Table 3: EBFORNN and IDMSCNN Comparison for Fold 1 Validation
|
Samples |
Technique |
DC |
Sensitivity (%) |
Specificity (%) |
JC |
F-Score (%) |
|
Leaf Spot |
EBFORNN |
99.88 |
98.85 |
99.92 |
99.66 |
99.63 |
|
IDMSCNN |
99.78 |
98.12 |
99.89 |
99.60 |
99.50 |
|
|
Leaf Blight |
EBFORNN |
99.77 |
98.94 |
99.88 |
99.67 |
99.61 |
|
IDMSCNN |
99.65 |
98.14 |
99.71 |
99.54 |
99.41 |
|
|
Common Rust |
EBFORNN |
99.71 |
98.15 |
99.85 |
99.71 |
99.68 |
|
IDMSCNN |
99.56 |
98.15 |
99.65 |
99.62 |
99.23 |
The analysis of different folds of validation samples on EBFORNN based segmentation techniques and IDMSCNN has been evaluated based on dice coefficient, Jaccard Coefficient, F measure, sensitivity, and specificity as shown in Table 3 for first fold validation data. The confusion matrix for the second validation data in EBFORNN Architecture is shown in Figure 4. This depicts True Positive (TP) 691 instances were correctly predicted as leaf blight. In comparison, False Positives (FP) of 0,4 and zero instances were predicted as leaf blight but belonged to common rust, leaf spot or healthy. False Negative (FN) instances of one common rust,3 leaf spot and zero healthy instances were predicted.
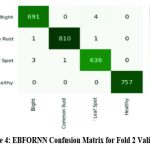 |
Figure 4: EBFORNN Confusion Matrix for Fold 2 Validation |
Similarly for Common Rust, Leaf Spot and healthy classes, TP, FP, FN and TN represent the concepts. TP of 810 as common rust, 636 as leaf spot, and 757 as healthy are highlighted. Table 4 shows the performance comparison of several metrics such as Dice Coefficient, Specificity, Sensitivity, Jaccard Coefficient, and F-Score for second-fold validation. It proves that EBFORNN segments plant disease regions with more accuracy compared to IDMSCNN on the basis of performance metrics.
Table 4: EBFORNN and IDMSCNN Comparison for Fold 2 Validation
|
Samples |
Technique |
DC |
Sensitivity (%) |
Specificity (%) |
JC |
F-Score (%) |
|
|
Leaf Spot |
EBFORNN |
99.90 |
94.90 |
99.94 |
99.70 |
99.68 |
|
|
IDMSCNN |
99.80 |
98.74 |
99.89 |
99.60 |
99.55 |
||
|
Leaf Blight |
EBFORNN |
99.80 |
98.84 |
99.89 |
99.70 |
99.66 |
|
|
IDMSCNN |
99.79 |
98.89 |
99.77 |
99.48 |
99.49 |
||
|
Common Rust |
EBFORNN |
99.87 |
98.45 |
99.78 |
99.79 |
99.72 |
|
|
IDMSCNN |
99.56 |
96.35 |
99.70 |
99.68 |
99.30 |
||
Results show the Dice Coefficient, Sensitivity, Specificity, Jaccard Coefficient and F-Score comparison of proposed EBFORNN with IDMSCNN. The metrics evaluated with EBFORNN segmentation produce higher values by taking an average of Fold 1 and Fold 2 validation data. The proposed EBFORNN takes 98.82% of the Dice Coefficient, 98.02% of Sensitivity, 99.88% of Specificity, 99.71 % of the Jaccard Coefficient, and 99.66% of
F-Score as an average in Fold 1 and Fold 2 Validation. From Figure 14, it is evident that the above metrics improve in EBFORNN except the Sensitivity metric when compared with IDMSCNN.So the proposed IDMSCNN achieves better results than IDMSCNN when uploading different maize diseased in the Matlab workspace.
Performance Analysis of Improved Gaussian Particle Swarm Optimized Convolution Neural Network (IGPSOCNN)
Experimental analysis using plant village dataset on the proposed model on the bacterial foraging explains the performance in terms of Dice Coefficient, Sensitivity, Specificity, Jaccard Coefficient and Accuracy towards disease identification on the sample of the maize crops.
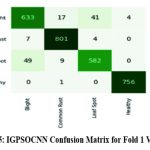 |
Figure 5: IGPSOCNN Confusion Matrix for Fold 1 Validation |
Figure 5 details the confusion matrix for the Fold 1 validation data IGPSOCNN with 30000 images. True Positive (TP) 633 instances were correctly predicted as leaf blight. In comparison, False Positive (FP) values of 17, 41 and 4 instances were predicted as leaf blight but belonged to common rust, leaf spot or healthy. False Negative (FN) instances of 7 common rust, 49 leaf spot and zero healthy instances were predicted. Remaining instances represents True Negatives instances leaving first row and column for leaf blight. Similarly concept applied for Common Rust, Leaf Spot and healthy classes, with TP, FP, FN and TN values.TP values of 801 common rust images, 582 leaf spot images, and 756 healthy images are highlighted.
Table 5: IGPSOCNN with EBFORNN Comparison for Fold 1 Validation
|
Samples |
Technique |
DC |
Sensitivity (%) |
Specificity (%) |
JC |
F- Score |
|
Leaf Spot |
IGPSOCNN |
99.98 |
96.85 |
99.92 |
99.87 |
99.80 |
|
EBFORNN |
99.88 |
94.82 |
99.92 |
99.80 |
99.78 |
|
|
Leaf Blight |
IGPSOCNN |
99.97 |
96.94 |
99.99 |
99.78 |
99.76 |
|
EBFORNN |
99.77 |
95.94 |
99.98 |
99.84 |
99.84 |
|
|
Common Rust |
IGPSOCNN |
99.99 |
98.15 |
99.95 |
99.89 |
99.89 |
|
EBFORNN |
99.71 |
97.15 |
99.85 |
99.89 |
99.88 |
The analysis on different fold validation samples of IGPSOCNN segmentation techniques have been evaluated on Dice Coefficient, Jaccard Coefficient, F-Score, Sensitivity and Specificity are shown in Table 5 for first fold validation data. On performance comparison, the proposed methodology IGPSOCNN’s result is better when compared with EBFORNN for Maize leaf disease prediction.
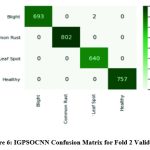 |
Figure 6: IGPSOCNN Confusion Matrix for Fold 2 Validation |
Figure 6 details the confusion matrix for the Fold 2 validation data of IGPSOCNN of 30000 images. True Positive (TP) 693 instances were correctly predicted as leaf blight, while False Positive (FP) prediction of 0, 2 and 0 instances were leaf blight but belonged to common rust, leaf spot or healthy. False Negative instances of zero common rust, leaf spot and healthy instances are predicted. Remaining was predicted as True Negative instances except first row and first column. Similarly for the Common Rust, Leaf Spot and healthy classes, TP, FP, FN and TN represent the concepts. TP values of 802 common rust images, 640 leaf spot images, and 757 healthy images are highlighted in Fold 2 validations of image data.
Table 6 highlights the performance outcomes of several metrics such as Dice Coefficient, Specificity, Sensitivity, Jaccard coefficient, and F-Score for second-fold validation. However, this provides performance analysis of the IGPSOCNN for Fold 2 validation data is higher towards maize leaf disease classification when compared with EBFORNN.
Table 6: IGPSOCNN and EBFORNN Comparison for Fold 2 Validation
|
Samples |
Technique |
DC |
Sensitivity (%) |
Specificity (% ) |
JC |
F- Score (%) |
|
Leaf Spot |
IGPSOCNN |
99.99 |
99.87 |
99.98 |
99.90 |
99.87 |
|
EBFORNN |
99.88 |
94.82 |
99.92 |
99.80 |
99.78 |
|
|
Leaf Blight |
IGPSOCNN |
99.97 |
99.87 |
99.99 |
99.84 |
99.81 |
|
EBFORNN |
99.89 |
99.71 |
99.99 |
99.90 |
99.88 |
|
|
Common Rust |
IGPSOCNN |
99.99 |
98.15 |
99.95 |
99.89 |
99.89 |
|
EBFORNN |
99.87 |
99.51 |
99.98 |
99.91 |
99.92 |
It is proven that the IGPSO Convolution Neural Network model segments plant disease regions with raised values when compared with EBFO Recurrent Neural Network based on growing algorithms. Table 6 shows the Dice Coefficient, Sensitivity, Specificity, Jaccard Coefficient and F Score comparison of proposed IGPSOCNN with EBFORNN.
The metrics evaluated with IGPSOCNN segmentation produce higher values by averaging Fold 1 and Fold 2 validation data. The proposed IGPSOCNN takes 99.98% of the Dice Coefficient, 99.31% of Sensitivity, 99.96% of Specificity, 99.86 % of the Jaccard Coefficient, 99.84 % of F Score as an average in Fold 1 and Fold 2 Validation. Figure 21 shows that the Dice coefficient, Specificity and Jaccard Coefficient are improved in IGPSOCNN, but Sensitivity and F Score are reduced compared to EBFORNN. So, it is finally concluded the proposed IDMSCNN achieves better results in maximum metrics than IDMSCNN when uploading different maize diseased in the MATLAB workspace.
Average Dice Coefficient, Sensitivity, Specificity, Jaccard Coefficient and F-Score of 3D U-Net, IDMSCNN, EBFORNN AND IGPSOCNN for Fold 1 and Fold 2 Validations
Specificity, Jaccard Coefficient and F Score are increased by taking average of Fold 1 and Fold 2 Validations than the existing 3D U-Net. The Dice Coefficient, Specificity, Jaccard Coefficient and F score of EBFORNN are increased but decreased in Sensitivity compared to IDMSCNN. The Dice Coefficient, Specificity of IGPSOCNN is increased, but Sensitivity and Jaccard Co efficiency are decreased when compared with EBFORNN.F Score is the same both in IGPSOCNN and EBFORNN. From the Table, it is proved that the proposed method IGPSOCNN outperforms IDMSCNN, EBFORNN and existing 3D U-Net when uploading Leaf Blight, Leaf Spot and Common Rust images during Fold 1 and Fold 2 validations in MATLAB 18b Workspace.
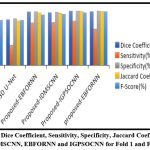 |
Figure 7: Average Dice Coefficient, Sensitivity, Specificity, Jaccard Coefficient and F-Score of 3D U-Net, IDMSCNN, EBFORNN and IGPSOCNN for Fold 1 and Fold 2 Validations. |
Figure 7 shows the average Dice Coefficient, sensitivity, specificity, Jaccard Coefficient and F-score for Fold 1 and Fold 2 Validations. The proposed IDMSCNN has an average value of Dice Coefficient of 99.63%, Sensitivity of 97.85 %, Specificity of 99.62 %, and Jaccard Coefficient of 99.48% and F-score of 99.31% is higher when compared with the existing 3D-U Net. The proposed IDMSCNN has an average value of Dice Coefficient of 99.82%, Sensitivity of 98.02%, Specificity of 99.88%, and Jaccard Coefficient of 99.71% and F-score of 99.66% is improved when compared with IDMSCNN. The proposed IGPSOCNN has an average value of Dice Coefficient of 99.98%, Sensitivity of 98.31%, Specificity of 99.96%, and Jaccard Coefficient of 99.86 % and F-score of 99.84% is improved when compared with EBFORNN.
Conclusions
The experimental results indicate that the proposed IDMSCNN method showed an increase in average metric values by 1.95% and 1.84% for leaf spot, 1.73% and 1.74% for leaf blight, and 0.41% and 1.50% for common rust images when compared with the existing 3D U-Net. The EBFORNN method showed an increase of 0.21% and a decrease of 0.69% for leaf spot images, an increase of 0.28% and 0.09% for leaf blight images, and an increase of 0.18% and 0.60% for common rust images when compared to the proposed IDMSCNN. The IGPSOCNN method showed an improvement in the average metric performance value by 0.44% and 1.08% for leaf spot images, 0.21% and 0.02% for leaf blight images, and an increase of 0.28% but a decrease of 0.26% for common rust when compared with IDMSCNN. These results highlight the effectiveness of the proposed methods in improving the segmentation and classification of diseased regions in maize leaf images.
Acknowledgements
I express my profound gratitude to the Divine for bestowing upon me the enthusiasm and wisdom necessary for the successful execution of my research work. I extend my deepest appreciation to Dr. B.K.Krishnaraj Vanavarayar B.Com., B.L., President, N.G.M College, and Thiru. M.Balasubramaniam M.Com., M.B.A., Secretary, N.G.M College, Pollachi, for their firm support and encouragement throughout my Ph.D. course. Their moral support has been instrumental in the successful completion of my research work.
My sincere gratitude goes to our former Principal, Dr. R.Muthukumaran M.A., M.Phil., B.Ed., Ph.D., N.G.M College, Pollachi, for providing the necessary facilities and creating an environment conducive to research.
I am extremely indebted to my guide Dr.S.Hemalatha M.C.A., M.Phil., Ph.D., Pollachi. Her scholarly guidance, invaluable encouragement, and illuminating ideas have been a beacon of light guiding me through the world of research.
I express my heartfelt gratitude to Dr.R.Manicka Chezian M.Sc., M.S., Ph.D., Associate Professor and Head of the Department of Computer Science (Aided), NGM College, Pollachi, for his solid support and guidance throughout my academic journey and research.
My steadfast thanks go to all my colleagues in the department and my close friends, whose valuable suggestions and timely guidance have been instrumental in the successful completion of this research work.
I would like to express my gratitude to Mr. G. Ravi Chandran for his assistance in completing this research work. I am deeply grateful to my husband Mr.N.Damodharan and my son D.Naren Kaarthic, who have been my pillars of strength and a constant source of inspiration in all my endeavors.
Funding Source
This study was funded by none
Conflict of Interest
The primary objective is to enhance the timeliness and accuracy of plant disease-type prediction. However, identifying relationships between attributes using unsupervised learning models can be complex and challenging. The current model has limited coverage 9 and poses integration challenges with other datasets due to varying formats. Moreover, determining the global minima in such high-dimensional datasets is a complicated task. The model’s inability to handle many missing values in high-dimensional and unstructured data further exacerbates the problem.
Data Availability Statement
The manuscript incorporates following dataset produced or analyzed during this research study.
https://iimr.icar.gov.in/PlantVillage Dataset. Kaggle. Retrieved from [https://www.kaggle.com/ datasets/abdallahalidev/plantvillage-dataset]
Ethics Approval Statement
Ethical approval for the study involving diseased maize leaves was granted by Plant Village dataset.
Authors’ Contributions
Dr P.Jayapriya designed the study, conducted experiments, analyzed the data, and wrote the manuscript.
References
- Chakravarthy A. S., & Raman S. Early blight identification in tomato leaves using deep learning. International Conference on Contemporary Computing and Applications,2020: 154–158. doi: 10.1109/IC3A48958.2020.233288.
CrossRef - Jayapriya P., & Hemalatha S.Bacterial Foraging Optimization based Recurrent Neural Network Approach for Identification and Classification of Maize Plant Disease. Third International Conference on Intelligent Computing Instrumentation and Control Technologies (ICICICT),2022: 35-43. doi: 10.1109/ICICICT54557.2022.9917607
CrossRef - Prasad B. K. V., Prasad M. V. D., Prasad C. R., Sasikala N., & Ravi, S. Flower Image Segmentation Using Watershed And Marker Controlled Watershed Transform Domain Algorithms. ARPN Journal of Engineering and Applied Sciences, 2018:13(21):51-64.
- Rastogi A., Arora R., & Sharma S. Leaf disease detection and grading using computer vision technology & fuzzy logic. 2nd International Conference on Signal Processing and Integrated Networks (SPIN) ,2015: 500–505.
CrossRef - Sindhu D., &Sindhu S. Image processing technology application for early detection and classification of plant diseases. Intern J Computer SciEngr, 2019: 7(5): 92-97.
CrossRef - Singh M. K., Chetia S., & Singh M. Detection and classification of plant leaf diseases in image processing using MATLAB. International Journal of Life Sciences Research, 2017:5(4):120–124.
- Sivagami S., &Mohanapriya S. Tomato leaf disease detection using image processing technique. International Journal of Agricultural Technology, 2021:17(3):1135-1146
- Venkataramanan A., Honakeri D. K. P., & Agarwal P. (2019). Plant disease detection and classification using Deep Neural Networks. Int. J. Comput. Sci. Eng, 2019:11(9): 40-46.