
Introduction
Odisha is a major region on the Indian map, covering a massive geographical area of 155,707 square kilometers. It is located in Eastern India and is the ninth-largest state in the country by land area. With 4.19 cores counted at the same census period, the state has a diversified population that contributes to the colorful fabric of India’s demographic landscape 1. The agriculture sector is part of the primary sector, which is responsible for a major portion of the state’s total Gross Value Added (GVA). In this industry, things are produced by the utilization of natural resources, which are essentially converted into primary products. The primary sector, which lays the groundwork for later manufacturing processes, is mostly reliant on the availability of natural resources for the creation of goods and other industrial operations in India. This industry, which is mostly based on forestry, fisheries, dairy, and agriculture, is all about using and extracting natural resources. In this industry, agriculture stands out as the most prominent example, but dairy, fisheries, and forestry are also important. Crop production, livestock, forestry, logging, fishing, and aquaculture are all included in the subsectors of agriculture2. Agriculture has always been important to Odisha’s past, as it is to the state’s efforts to ensure food security, reduce poverty, promote inclusive prosperity, spur economic growth, and achieve sustainable development objectives. The agricultural sector’s part of the Gross State Value Added (GSVA) has exhibited a variable pattern, with an approximate 20 percent share maintained. Agriculture and related activities account for approximately 20.6 percent of GSVA in the fiscal year 2021–2022, an increase of nearly one percentage point over the levels seen in 2018–19. The reason for this growth is the tremendous expansion that occurred between 2018–19 and 2020–21. The crop sub-sector is a major player in Odisha’s agricultural economy. It contributes 12.25 percent of the state’s overall Gross State Value Added (GSVA) in 2021–22 and 59.5 percent of the GSVA in the agriculture and allied sector. Livestock, fisheries, and forestry contributed 15.8%, 11.8 %, and 12.9 %, respectively, to the agriculture and allied sector GSVA in the same fiscal year3.
Agriculture and Its Sub Sectors
The four main sub-sectors that make up the agriculture sector—crop production, animal farming, forestry, and fishing are essential to the economy. The process of growing different plants for food, fiber, and raw materials is known as crop production. Raising animals for food items like meat, milk, and other byproducts is the main goal of livestock farming. The sustainable management of forests for the production of paper, wood, and environmental preservation is known as forestry. The harvesting of aquatic life from freshwater or marine environments is referred to as fishing, and it plays a role in both economic and food security. When taken as a whole, these subsectors significantly influence the agriculture sector’s overall landscape by supplying food, raw materials, and means of subsistence.
Crop
The crop sub-sector is a significant player in Odisha’s agricultural economy. It accounts for 59.5 percent of the Gross State Value Added (GSVA) for the agriculture and allied sector and 12.25 percent of the GSVA for the state as a whole in the fiscal year 2021–2022. There was a minor deceleration in the crop sub-sector growth rate from 17.91 percent in 2019–20 to 11.52 percent in 2020–21. Nonetheless, the agriculture subsector saw significant difficulties in 2021–2022, with an estimated decrease of 7.95 percent at constant prices 3. This section will delve into the dominant crops grown in Odisha and their contribution to the Gross State Value Added (GSVA). It will highlight challenges faced by crop production, such as water scarcity and pest control, and explore government initiatives aimed at promoting crop diversification and high-value crops.
Livestock
The growth of the livestock sub-sector is essential for increasing farmers’ incomes, especially for small and marginal farmers, and it also makes a major contribution to the elimination of poverty. Research indicates that the expansion of the livestock industry, especially in the dairy sector, has significant potential to reduce poverty. The Gross State Value Added (GSVA) for the livestock sub-sector in the fiscal year 2021–22 is 3.26 percent, while the GSVA for the agriculture and allied sector is 15.83 percent 3. Focusing on dairy production, this section will examine its role in poverty reduction. It will discuss strategies for improving livestock breeds and enhancing productivity, as well as plans for developing veterinary services and animal health infrastructure.
Forestry
At current prices, forestry accounted for 12.90 percent of the Gross State Value Added (GSVA) for the agriculture and allied sector in the fiscal year 2021–2022, and 2.66 percent for the GSVA overall. The forestry sub-sector is expected to develop at a pace of 4.89 percent in 2021–2022, which is a significant increase from the 1.71 percent growth recorded in 2020–21. When compared to other significant subsectors, the forestry sector’s 2021–22 growth rate is very noteworthy 3. This forestry sub sector will explore sustainable forest management practices for timber and non-timber products in Odisha. It will address the challenge of balancing economic development with environmental conservation and discuss the role of forestry in mitigating climate change.
Fishery
The State’s long coastline and plenty of water resources make the fisheries subsector important. The 2015 Fishery Policy is indicative of the government’s emphasis on advancing pisciculture. According to the Odisha Economic Survey (2021–22), the fishing sub-sector makes up 11.81 percent of the GSVA for the agriculture and allied sector at current prices and adds 2.43 percent to the overall Gross State Value Added (GSVA) in the fiscal year 2021–2022 3. Examining both marine and freshwater fisheries, this fishery sub sector will explore their potential in Odisha. It will discuss the development of aquaculture and its impact on fish production, as well as strategies for improving post-harvest infrastructure and market access for fish products.
Literature Review
The majority of Odisha’s economy is based on agriculture, which has become the state’s main industry. With a nearly 27% contribution to the state’s Gross State Domestic Product (GSDP), this important industry has a considerable impact on the state’s economic environment. The significant presence of agriculture highlights its critical role in determining Odisha’s economic development (Singh S. 2017)4. A significant portion of Odisha’s economy is derived from agriculture, which includes a variety of activities like forestry, fisheries, cattle, and crops. From a strategic standpoint, the fight for long-term economic development will come down to success or failure in this area. Since agriculture typically plays a major role in the early stages of economic growth in many nations, it is imperative to emphasize the importance of agricultural development in economic success (Mallick S.K. & Pany T. 2017)5. For most people, agriculture continues to be their main source of income. In Odisha, the agriculture and allied sector’s share of the Gross State Value Added (GSVA) was around 20.61 percent in the fiscal year 2021–22 (Advance Estimates) and 23.63 percent in the previous fiscal year 2020–21 (Revised Estimates). Similarly, the Directorate of Economics and Statistics of Odisha19 reports that in the fiscal year 2020–21, the combined contribution of the agricultural and related sectors to the Gross Value Added (GVA) was 19.99 percent at the national level. India’s growth and development were covered in a journal paper titled “Pareto Analysis on the Regional Development of Odisha” (Chand D. and Gartia R. 2019)6. The paper titled “Statistical Analysis of Sector-wise Gross Value Added (GVA) in Odisha” employed Pareto analysis to identify the Vital Few Sectors (VFS) that collectively contribute to 80% of the state’s total GVA. (Sahu P. &Gartia R. 2022)7. These estimates also aid in the development of appropriate planning, programs, and policy implementation for the VFS.
Objectives
The primary goal of the current investigation
To investigate the contribution of the agricultural sub-sectors to the Gross Value Added (GVA) of Odisha at current basic prices.
To identify the Vital few and trivial many sub-sectors contributing 80% and 20% to overall GVA of Odisha by Pareto’s 80/20 rule.
To conduct trend analysis and assess the agriculture’s potential in Odisha’s economic growth through linear regression analysis.
To suggest policy decisions for the developments of vital few agricultural sub-sectors so that the remaining Trivial many sub-sectors will automatically be benefited.
Data and Methodology
Data
This research centers on the analysis of Gross Value Added (GVA) data specific to the state of Odisha. The dataset utilized is derived
from both the Economic Survey of 2021-2022 and the Directorate of Economics and Statistics of Odisha. The study spans the timeframe from
2011-12 to 2021-22, comprising a total of 70 data points. Noteworthy is the focus on the pivotal sub sectors i.e. Crop , known as the Vital
Few Sectors (VFS), identified through Pareto curve analysis. The sub sectors collectively contribute a significant 80% to the overall GVA of Odisha.
Research Methodology
This study delves into the contributions of various industries, with a particular focus on agricultural sub-sectors, to Odisha’s Gross Value Added (GVA). It analyses the percentage contribution of each sub-sector to the state’s GVA over a chosen period, examining both the average and overall contribution using time series data at current and constant prices.
Pareto’s 80/20 Rule
The study utilizes Pareto’s principle, also known as the 80/20 rule, as a core framework. This principle suggests that in many situations, a small portion (20%) of elements contributes significantly (80%) to the overall outcome. Here, it’s applied to identify a handful of critical agricultural sub-sectors, termed Vital Few Sectors (VFS), that have a substantial impact on Odisha’s total GVA. These VFS are the areas where we’ll focus our analytical efforts.
By applying Pareto’s principle to identify the VFS, this study utilizes various analytical techniques to gain a deeper understanding of these critical sub-sectors and their role in shaping Odisha’s economic landscape.
ANOVA Test
To assess if there are significant differences in the average GVA contributions between agricultural sub-sectors, the study employs Analysis of Variance (ANOVA). This test utilizes Least Significant Differences (LSD) to pinpoint which sub-sectors have statistically distinct average GVA.
Linear Regression for GVA Estimation
The study aimed to forecast GVA for Odisha’s vital agricultural sub-sectors (VFS). While ARIMA, a powerful time series forecasting method, was ideal, data limitations necessitated a switch to linear regression. The study employs Linear Regression analysis to compare anticipated GVA values with actual contributions across designated sub-sectors in Odisha. Discrepancies between predicted and actual GVA figures offer insights into potential future changes in the state’s GVA. Furthermore, the research aims to forecast GVA trends in agricultural sub-sectors from 2021–2022 to 2025–2026.
For linear regression analysis, the key assumption regarding the data is Normality of Errors: The errors, or residuals, in the data should follow a normal distribution (bell-shaped curve). This assumption ensures the validity and reliability of the model’s predictions. The study verifies this assumption using the One-Sample Kolmogorov-Smirnov Test. If normality is not confirmed, the study might need to consider data transformations or alternative statistical techniques more suitable for non-normal data. The study ensured the data met normality assumptions, crucial for linear regression’s validity, by employing the One-Sample Kolmogorov-Smirnov Test.
Finally, the study attempts to forecast the GVA of agricultural sub-sectors from 2021-2022 to 2025-2026 using data analyzed in Microsoft Excel and SPSS software.
Research Gap
Despite highlighting noteworthy growth in Odisha’s agricultural sector, the study reveals several areas demanding further exploration. Firstly, the focus solely on agriculture overlooks the potential contributions of non-agricultural sectors to the state’s Gross Value Added (GVA). A broader analysis encompassing the entire economy would provide a clearer picture of economic development opportunities. Secondly, the study relies solely on statistical analysis, missing valuable insights from industry experts. Qualitative research methods could enrich the understanding gained from quantitative data. Thirdly, the short-term forecasting horizon limits our view of long-term trends and potential challenges. Extending this timeframe would be beneficial. Finally, the use of specific software might limit accessibility for some researchers. Exploring open-source alternatives or providing detailed methodologies could enhance research accessibility and reproducibility. Addressing these gaps will strengthen future studies and contribute to a more comprehensive understanding of Odisha’s agricultural sector and its role in the state’s economic development.
Statistical Hypotheses Regarding Agricultural Sub-Sectors in Odisha
Null Hypothesis (H₀): There exist no significant difference in the average Gross Value Added (GVA) contribution among the four agricultural sub-sectors (crop, livestock, forestry, and fishing) in Odisha.
Alternative Hypothesis (H₁): There exist significant difference in the average Gross Value Added (GVA) contribution among the four agricultural sub-sectors (crop, livestock, forestry, and fishing) in Odisha.
Results and Discussion
Table 1: Sectoral contributions of agricultural sub-sectors to GVA (in Rs.) of Odisha:
|
Year |
Crops |
Livestock |
Forestry |
Fishing |
|
2011-12 |
2555039 |
538911 |
572223 |
268365 |
|
2012-13 |
3750538 |
637320 |
619884 |
335124 |
|
2013-14 |
3802014 |
729849 |
784937 |
358168 |
|
2014-15 |
4436266 |
803496 |
864086 |
453110 |
|
2015-16 |
3765010 |
880542 |
957598 |
560391 |
|
2016-17 |
4707586 |
909690 |
1108049 |
699883 |
|
2017-18 |
4427627 |
1188323 |
1022004 |
856198 |
|
2018-19 |
5093549 |
1417177 |
1249957 |
949042 |
|
2019-20 |
6337952 |
1621238 |
1310864 |
1087503 |
|
2020-21 |
6993564 |
1678296 |
1356323 |
1215655 |
|
2021-22 |
6798635 |
1810747 |
1475688 |
1350349 |
The Gross Value Added (GVA) for the state of Odisha in various sectors from the fiscal years 2011–12 to 2021–22 is shown in the Table 1. The crop sub-sector makes the highest contributions to the total GVA of the agriculture sector in Odisha. Fishing has moderate growth, whereas livestock and forestry exhibit consistent increase. The agriculture sector has the highest GVA and makes a major economic contribution to Odisha. Agriculture continues to be a major contributor to the state’s economic growth.
Table 2: Percentage share of GVA contributions (in Rs.) of agricultural sub-sectors
|
Sector |
Total GVA Contribution |
Percent contribution |
|
Crops |
52667780 |
17.11 |
|
Livestock |
12215589 |
3.97 |
|
Forestry |
11321613 |
3.68 |
|
Fishing |
8133788 |
2.64 |
Table 2 shows the percentage contributions of each sector to the overall economy as well as the total gross value added (GVA) contributions. Crops make up the largest portion of the agriculture sector (17.11%), with livestock (3.97%) and forestry (3.68%) following closely behind, both of which are crucial to the economy. A diverse economy is demonstrated by the table’s evenly distributed distribution of GVA contributions across the main sectors. Furthermore, some sections of the Agriculture sector seem to have more detail, offering insights into the contributions of particular areas. Information is presented in descending order of GVA contribution. The table, in summary, provides a thorough overview of a diversified economy, highlighting the significant contributions made by the agriculture sub-sectors.
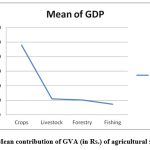 |
Figure 1: Mean contribution of GVA (in Rs.) of agricultural sub-sectors |
Figure 1 above displays the average GDP contribution of forestry, fisheries, agriculture, crops, livestock. The graph’s data indicates that the crop sub-sector contributes the most GVA to Odisha’s total GVA. On the other hand, the subsector of fishing contributes the least to Odisha’s total GVA.
Table 3: Percentage growth of agricultural sub-sectors
|
Years |
Crops |
Livestock |
Forestry |
Fishing |
|
2012-13 |
23.42 |
2.12 |
-3.45 |
12.44 |
|
2013-14 |
-9.17 |
9.64 |
9.34 |
-1.68 |
|
2014-15 |
10.11 |
-3.6 |
5.69 |
13.52 |
|
2015-16 |
-22.19 |
4.83 |
5.75 |
10.58 |
|
2016-17 |
23.27 |
3.15 |
21.81 |
21.94 |
|
2017-18 |
-20.1 |
8.4 |
-7.72 |
17.08 |
|
2018-19 |
9.11 |
11.05 |
7.46 |
8.72 |
|
2019-20 |
17.91 |
4.7 |
0.88 |
9.19 |
|
2020-21 |
11.52 |
0.04 |
1.71 |
3.89 |
|
2021-22 |
-7.95 |
-1.05 |
4.89 |
7.5 |
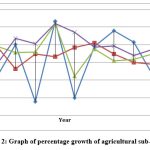 |
Figure 2: Graph of percentage growth of agricultural sub-sectors |
The yearly rise in percentage in agriculture and its related subsectors for the specified years is shown in the Figure-2. When sub-sectors of agriculture were examined, crops showed steady variation, showing rise in a number of years but a severe fall in 2013–14 and 2015–16. In general, livestock growth was favorable; substantial gains occurred in 2013–14, 2016–17, and 2018–19, with a slight fall in 2021–22. The forestry sector saw considerable increases in some years, but declines in 2016–17 and 2019–20. Fishing showed steady upward growth, with a notable downturn in 2015–16 and upward growth in the years that followed. While there was a general comeback and several sectors had good development, the overall trend across the agriculture sub-sectors indicates various outcomes, with considerable variations in some years indicating mixed results with both positive and negative growth.
Table 4: Descriptive statistics of agricultural sub-sector wise contribution to GVA (in Rs.) of Odisha
|
Sectors |
Minimum |
Maximum |
Mean |
Std. Error |
Std. Deviation |
|
Crops |
2555039 |
6993564 |
4787980.00 |
423664.191 |
1405135.158 |
|
Livestock |
538911 |
1810747 |
1110508.09 |
136736.772 |
453504.569 |
|
Forestry |
572223 |
1475688 |
1029237.55 |
90910.528 |
301516.110 |
|
Fishing |
268365 |
1350349 |
739435.27 |
113820.569 |
377500.120 |
Table-4 above provides an overall view for the total GVA as well as information on the central tendency, variability, and precision of the mean estimate for each GVA category of all agricultural sub-sectors. With a mean GVA contribution of 6993564, Crop is the subsect with the largest contribution among the individual sub-sectors. On the other hand, at Rs. 1350349., fishing has the lowest mean GVA contribution.
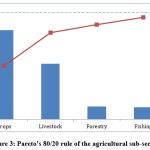 |
Figure 3: Pareto’s 80/20 rule of the agricultural sub-sectors |
The graph shows the pareto analysis of the three main sectors the agricultural subsectors of crops, livestock, forestry, and fishing according to Juran’s 80/20 rule. This demonstrates that the nine remaining sectors have the lowest overall GVA contributions and are referred to as Trivial many sectors (TMS). The sub-sector crops that have big and significant contributions to the total GVA is classified as Vital few sector (VFS). The agricultural sub-sector, crop is chosen as a VFS sector in this study and used for research purposes.
Table 5: One Sample Kolmogrov- Smirnov Test of agricultural sub-sectors:
|
Crops |
Livestock |
Forestry |
Fishing |
|
|
Normal Parametersa,b |
7667161 |
4787980 |
1110508 |
1029238 |
|
2494056 |
1405135 |
453504.6 |
301516.1 |
|
|
Most Extreme Differences |
0.164 |
0.159 |
0.217 |
0.132 |
|
0.164 |
0.159 |
0.217 |
0.095 |
|
|
-0.132 |
-0.139 |
-0.143 |
-0.132 |
|
|
Test Statistic |
0.159 |
0.217 |
0.132 |
0.14 |
|
Asymp. Sig. |
.200c,d |
.157c |
.200c,d |
.200c,d |
The table 4 shows the results of a One-Sample Kolmogorov-Smirnov (K-S) Test conducted on a variety of factors related to industries like crop,livestock forestry, and fishing. This test is used to determine whether there is a significant deviation from a normal distribution in each sector’s data distribution. The K-S test results show that the data for all sectors in the table conforms to a normal distribution because the p-values for each sector in the table are more than 0.05, indicating a lack of significant evidence to reject the null hypothesis.
ANOVA test (Analysis of Variance) for the Agricultural Sub-Sectors:
The significance of the statistical differences between the means of different groups is evaluated using the ANOVA test. The significant F-statistic (59.75) shows the diversity between the group means is greater than what would be predicted by pure chance. This observation is further supported by the extremely small p-value (0.000), which indicates that the differences in group means are statistically significant. In summary, the ANOVA test shows that there are notable differences between group or category means in terms of GVA. This suggests that the mean GVA of at least one group differs noticeably from the others.
Table 6: Multiple comparison among the agricultural sub-sectors by Least Square Difference Method:
|
(I) Sector |
(J) Sector |
Mean Difference (I-J) |
Std. Error |
Sig. |
95% Confidence Interval |
|
|
Lower Bound |
Upper Bound |
|||||
|
Crop |
Livestock |
3677471.909* |
331216 |
0 |
3008059.31 |
4346884.51 |
|
Forestry |
3758742.455* |
331216 |
0 |
3089329.86 |
4428155.05 |
|
|
Fishing |
4048544.727* |
331216 |
0 |
3379132.13 |
4717957.33 |
|
|
Livestock |
Crop |
-3677471.909* |
331216 |
0 |
-4346884.51 |
-3008059.31 |
|
Forestry |
81270.55 |
331216 |
0.807 |
-588142.05 |
750683.14 |
|
|
Fishing |
371072.8 |
331216 |
0.269 |
-298339.78 |
1040485.42 |
|
|
Forestry |
Crop |
-3758742.455* |
331216 |
0 |
-4428155.05 |
-3089329.86 |
|
Livestock |
-81270.5 |
331216 |
0.807 |
-750683.14 |
588142.05 |
|
|
Fishing |
289802.3 |
331216 |
0.387 |
-379610.33 |
959214.87 |
|
|
Fishing |
Crop |
-4048544.727* |
331216 |
0 |
-4717957.33 |
-3379132.13 |
|
Livestock |
-371073 |
331216 |
0.269 |
-1040485.42 |
298339.78 |
|
|
Forestry |
-289802 |
331216 |
0.387 |
-959214.87 |
379610.33 |
|
*. The mean difference is significant at the 0.05 level
The results of a multiple comparisons study using the Least Significant Difference (LSD) approach are displayed in Table 6, which evaluates differences in the mean GVA between different sectors. Finding noteworthy variations in the mean GVA between sector pairs is the aim of this investigation. Crop, Livestock, Forestry, and Fishing are the other sectors with which the agriculture sector differs statistically significantly (at the 0.05 level). Similar noteworthy distinctions are also noted between the crop industry and the other industries, which include livestock, forestry, and fishing.
When compared to all other industries, the agriculture industry has the highest Gross Value Added (GVA) and thus the highest Gross Domestic Products (GVAs). The subsector of fishing, on the other hand, has the lowest GVAs. Several sectors show significant differences in GVA, as shown by persistently low p-values below 0.05. Every industry, such as agriculture, crop, livestock, forestry, and fishing, exhibits significant differences in GVA. To sum up, the study of repeated comparisons highlights significant differences in the average GVA levels between different industries. Asterisks (*) denote statistical significance at the 0.05 level and offer important information about the various contributions made by each sector to the total GVA as well as economic inequality. To assess if trend fitting is suitable, a variety of techniques have been used, including linear, polynomial, power, and exponential trend analysis. In order to determine which trend best fits each unique sector, these analyses fit various types of trends to the data on Gross Value Added (GVA) contributions across all sectors.
Trend fitting Analysis of GVA contributions of Sectors
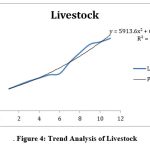 |
Figure 4: Trend Analysis of Livestock. |
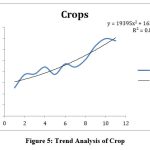 |
Figure 5: Trend Analysis of Crop |
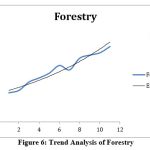 |
Figure 6: Trend Analysis of Forestry |
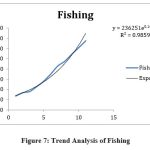 |
Figure 7: Trend Analysis of Fishing |
The provided information in graph 4 to 7 suggest a positive trend in the agricultural sector of Odisha. There’s a steady increase in the Gross Value Added (GVA) of livestock, and the number of crops grown, as indicated by the positive slopes and high R-squared values in the corresponding graphs. Additionally, the graphs for forestry and fishing show exponential growth, implying a significant rise in their economic contributions.
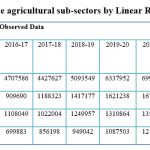 |
Table 7: Forecasting of the agricultural sub-sectors by Linear Regression Analysis. |
The table shows actual and projected data for the main industries- crops, livestock, forestry, and fishing for the years 2011–12–2025–26. The crop sub-sector exhibits a typically upward trend, reaching its maximum Gross Value Added (GVA) contribution of Rs. 8,354,267 in 2025. In a similar vein, the livestock industry is expanding, with 2,293,457 units sold in 2025. The forestry industry is growing gradually and is expected to reach Rs. 1,839,193 in 2025. Last but not least, the subsector of fishing is growing positively, reaching Rs. 1,720,200 in 2025. The table presents promising patterns in the GVA contributions for different sectors, which mirror the changing dynamics and growth tendencies of the economy throughout the designated years.
Policy Implications and Discussion
In order to meet market demands and boost profitability, improved agricultural production strategies in Odisha might emphasize the growth of high-value commodities such as fruits, vegetables, spices, and medicinal plants as well as crop diversification. Better seed and technical advice might be given to farmers, and techniques like crop rotation and intercropping could be encouraged. Water management initiatives can increase water efficiency and lessen reliance on rainfall. These initiatives include developing water storage facilities and implementing contemporary irrigation techniques like drip and sprinkler systems. It’s also critical to promote water conservation measures among farmers through incentives and awareness programs. Sales can be increased by creating direct marketing connections between farmers and customers through Farmer Producer Organizations (FPOs) and farmer markets, as well as by enhancing market access by placing collecting centers, storage facilities, and processing units closer to farms. Cold chain infrastructure investments can also reduce post-harvest losses and improve product quality. Encouraging climate-resilient cultivars, composting, and organic farming are examples of sustainable practices that can improve soil fertility and lessen the effects of climate change. It is crucial to give farmers the financial and technical assistance they need to implement these techniques. Efficiency can be increased by utilizing technology, such as computerized instruments for weather forecasting, the sharing of market information, and precision agricultural methods. It can also be advantageous to promote the usage of mobile applications for pest control and agricultural guidance. Crop production investments have a spillover effect on other industries, such as forestry and fishing. For example, prosperous agricultural subsectors can boost rural economies by creating a greater market for fish and forestry products. The distribution of these goods can be made easier with improved rural infrastructure from agricultural investments, and expanding into fish farming alongside crops can give farmers alternative revenue streams and promote collaboration across various industries.
Conclusion
Using data from the Odisha Economic Survey 2021–22 (Tables 01 & 02), this study attempts to explore and evaluate the contributions of agriculture and its subsectors to Odisha’s economy from 2011–12 to 2021–22. According to a linear regression model, Table-02 notably shows a notable increase in the Agricultural Sector’s contribution to the total Gross Value Added (GVA), reaching 27%. The findings of the ANOVA and F-test highlight a significant difference between the average contributions of the agricultural subsectors to the GVA from 2011–12 and 2021–22. In summary, there is a notable difference in these subsectors’ performance with respect to GVA contributions over the given time frame. To encourage the growth of the state’s agricultural subsector, the Odisha government has put in place a number of policy initiatives. A multipronged approach is needed to enable substantial development in the agriculture sector of Odisha. Prioritizing irrigation and water management, encouraging crop variety while supporting high-value commodities, implementing modern agricultural technologies through training initiatives, and offering financial support particularly to small farmers are all part of this. For overall growth, it is imperative to strengthen market links, rural infrastructure, and sustainable practices in addition to risk mitigation strategies like insurance and forecasting.
Acknowledgement
We would like to express our gratitude in particular to Dr. Rajendra Gartia, Assistant Professor and Department Head at G.M. University, Amruta Vihar, Sambalpur, for his insightful advice and professional direction during the course of the study. His knowledge has greatly improved the caliber of our work.
We also thank G.M. University, Amruta Vihar, Sambalpur, for setting up a supportive research atmosphere and lending us the resources we needed. Their assistance has been crucial in helping us carry out our research.
We sincerely thank our family members for their unfailing encouragement and support during this trip. We also appreciate everyone who has given us advice and criticism, which has allowed us to improve and hone our work.
We would like to once again convey our sincere gratitude to everyone who has contributed to our research project. Their assistance and efforts were essential to the completion of this work.
Funding Sources
The author(s) received no financial support for the research, authorship, and/or publication of the article.
Conflict of Interest
The authors do not have any conflict of interest.
Data Availability Statement
Source: Odisha Economic Survey 2021-22, Government of Odisha.
Ethics Statement
This research did not involve human participants, animal, subjects, or any material that requires ethical approval.
Informed Consent Statement
This study did not involve human participants, and therefore, informed consent was not required.
Authors’ Contribution
Pritipadma Sahu and Suru Munda contributed to data collection and compilation. The analysis of the data and writing of the manuscript has been done by Pritipadma Sahu. The overall work has been supervised and edited by Dr. Rajendra Gartia.
References
- Census. Census of India. Retrieved May 2019, from Registrar General of India, Ministry of Home Affairs, Government of India.2011
- Reddy, K. Analysis and Comparison of Overall GVA Depending Only on Three Major Sectors in Indian Economy”, Catalyst – Journal of Business Management (CJBM), 2019;1(1).
- Odisha Economic Survey.Bhubaneswar: Planning and Convergence Department, Directorate of Economics and Statistics, Government of Odisha, https://odisha.gov.in/sites/default/files/2022-03/Economic_Survey_2021-22_0.pdf
- Singh S. Development of Agriculture Sector in Odisha: Post Liberalization scenario, Agriculture & Food Security – Emerging Issues &Perspectives Edition: 1st, Chapter: 8, Publisher: Kumud Publication. 2017:116-127
- Mallick S.K., Pany T.K. Agricultural Finance in Odisha: A Comparative Study of Farmers Perception and Bankers attitude towards agricultural credit. International Journal of Academic Research ISSN: 2348-7666. 2017; 4: 12(2)
- Chand D, Gartia R. Pareto Analysis on the Regional Development of Odisha, growth and development in India. Publisher: Segment Books, New Delhi, 2019;155-184
- Sahu P. & Gartia R. Sector wise gross value added (GVA) in Odisha: A statistical analysis, International Journal of Statistics and Applied Mathematics.2022;7(4):128-135
- Agarwal, A.N. Indian Economy. New Age International Publishers, New Delhi, 2011.
- Bajpai, N. Business Statistics. Dorling Kindersley (India) Pvt. Ltd., New Delhi (Licensees of Pearson Education in South Asia), 2010.
- Bandral, N. Service Sector in India’s Economic Growth. International Journal of Research, 2014; 1(5):972-981.
- Chawla, D. and Sondhi, N. Research Methodology. Vikas publishing House Pvt. Ltd., New Delhi, 2011
- Garg, I. and Walia, S. An Analysis of Service Sector in Indian Economy. International Journal of Research and Social Sciences. 2013; 3(3):8-18.
- Gulati, A. et al. (eds.) Drivers of Agricultural Growth in Odisha, Revitalizing Indian Agriculture and Boosting Farmer Incomes, India Studies in Business and Economics. 2021.
CrossRef - Hoda, A., Rajkhowa, P., & Gulati, A. Working Paper 337: Transforming Agriculture in Odisha: Sources and Drivers of Agriculture Growth. New Delhi: Indian Council for Research on International Economic Relations.2017.
- Jhingan, M.L. Macro Economic Theory. Vrinda Publications (P) Ltd., New Delhi, 2010.
- Keshava, S.R. Economics. New Age International Publishers, New Delhi, 2010.
- Krishnaswamy, K.N., Sivakumar, A.I. and Mathirajan, M. Management Research Methodology. Dorling Kindersley (India) Pvt. Ltd., New Delhi (Licensees of Pearson Education in South Asia),2006.
- Lashmi, P. and Kumar, S. Economic Growth and Impact of Service Sector in India. International Journal of Business, Management and Economics. 2012;3(5):627-632.
- Levine, D.M., Stephan, D.F. and Szabat, K.A. Statistics for Managers. PHI Learning Private Limited, Delhi, 2014.
- Lipsey, R. and Chrystal, A. Economics. Oxford University Press, Oxford, U.K, 2011.
- Malhotra, N. and Dash, S. Marketing Research: An Applied Orientation. Dorling Kindersley (India) Pvt. Ltd., New Delhi (Licensees of Pearson Education in South Asia), 2011.
- Misra, S.K. and Puri, V.K.Indian Economy. Himalaya Publishing House, New Delhi,2011.
- Odisha DES. (Various Issues). Odisha Agriculture Statistics. Bhubaneswar: Directorate of Economics and Statistics of Odisha.
- Paneerselvami, R. Research Methodology. PHI Learning Private Limited, Delhi, 2004.
- Samuelson, P.A. and Nordhaus, W.D. Economics. Tata McGraw-Hill Publishing Company Ltd., New Delhi, 2005.
- Sharma, J.K. Business Statistics. Dorling Kindersley (India) Pvt. Ltd., New Delhi (Licensees of Pearson Education in South Asia), 2007.
- Tiwari, S. Service Sector in India: Performance and Reforms. International Journal of Multidisciplinary Research, . 2011;1(7):155-162.