
Introduction
Barley (Hordeum vulgare L.) is a prominent cereal grain also known as a halophyte1. It is among the world’s earliest domesticated crop species2, exhibiting wide adaptation to diverse environmental conditions3. Barley is mainly used to feed the livestock and also serves as a good source of food and human drink4. It is commonly used as a model crop to decipher the mechanisms related to salinity tolerance in cereals due to its simpler genome5. The area and production of barley is less and less every year because of its decreasing priority among the cereals and thereby its cultivation on marginal lands i.e. drought and saline conditions6. Though barley is a salinity tolerant cereal crop where, six-row type barley has an edge for salt tolerance over the two-row types. Similarly, hull-less and winter type barley showed high salinity tolerance compared to hulled and spring types, respectively 7. This nutri cereal holds fourth position in terms of harvested area (46.90 million hectares) and global production (142.64 million tonnes) during 2022-238 however; it ranks first in terms of its cultivation in a variety of climates9. In India, barley was registered with an output of 1.69 million tonnes during 2022-23 from 0.62 million hectare with average national productivity of 27.33 q/ha. It is being frequently used to predict the crop response to climate change, worldwide10.
Abiotic stresses are able to upset growth and performance of crops. Salinity stress is perhaps the most challenging abiotic stress worldwide, approximately affecting 20% of the world’s total cultivated area and consequenting about 20% yield losses11. It is well documented that approximately 32 mha of dry lands and 60 mha of irrigated lands are affected by human controlled soil salinization12. Salt accumulation in the soil annually converts approximately 1.5 mha of arable land to non-arable land as a consequence of heavy application of chemical fertilizers, continuous use of brackish water for irrigation, intensive farming systems, as well as abrupt climatic changes. Hence, it is apprehended that the soil salinity will account for 50% of the world’s agricultural land by 205013.
Salt stress generally affects the plant growth by osmotic stress, ionic toxicity and a reduced ability to take up essential minerals12. These phenomena interrupt various metabolic processes including the inactivation of certain enzymes14. For salinity tolerance improvement in plants, ion and osmotic homeostasis includes several ion transporters responsible for allocation of toxic ions at cellular and organ levels which play a significant role under stress conditions15. Salinity decreases the availability of water to plants and also affects the processes that determine the yield in different genotypes16. In barley, grain size and carbohydrate content reduction was also reported under salinity while protein increased4. Moreover, salinity significantly reduces photosynthetic activities, transpiration as well as stomatal conductance17. Whether plant responds to salinity either by escape or tolerance, it is vital to understand physiological, biochemical, and molecular mechanism of salt tolerance for the identification and introgression of related genes to make the crop more resilient towards salinity stress15. Barley can be a major source of genes for stress tolerance because of its high diversity and adaptability18.
Barley seems to show higher sensitivity during the early growth stages, consequently barley genotypes should also be assessed for salt tolerance at germination and seedling growth stages in the fast-tracking tolerance breeding programs19. Landraces often showed adaptation to the stressful environments, be included in barley pre-breeding programs invariably as recipient rather than as donor parents for improving the yield potential and grain nutritional quality without altering their adaptation for sustaining the global food and nutritional security. In the present scenario of climate change and genetic erosion, the exploitation of genetic diversity existing in the wild subspecies of Hordeum spontaneum is highly desirable for barley salinity tolerance20. Moreover, marker-assisted and omics-based biotechnological tools facilitate barley breeders to transfer gene(s)/QTLs from landraces/wild species to elite cultivars while curtailing linkage drag like problems7.
The identification and utilization of salt tolerant genotypes is quite essential for exploiting the saline soils. Therefore, the appliance of appropriate criteria is vital for selection of genotypes21. Several selection indices have been proposed22; that may be selected by researchers based on nature and severity of stress in the targeted environment16 and if utilized under real field condition, would be more advantageous. Such indices are the indicator of crop plant behavior under stress by reflecting crop yield under stress and non-stress conditions4. Consequently, this research work aimed at to assess the response of 14 genotypes to salinity stress using a set of twelve stress indices including SSI, TOL, STI, SSPI, YI, YSI, RSI, MP, GMP, HM, MRP and RED intended to develop salt tolerant varieties.
Materials and Methods
An experiment was executed in Randomized Block Design during crop season 2021-22 with a set of fourteen barley genotypes at Research Area of the Department of Genetics and Plant Breeding, Chaudhary Charan Singh Haryana Agricultural University, Hisar (latitude 29°10′N, longitude 75°46′E and altitude 215.2 m). The experimental material comprised of both two (6) and six (8) row types and was evaluated under two environmental conditions i.e. non-stress (Optimal/Normal) and stress conditions (Salinity stress). Under non-stress, each genotype occupied a plot size of 6.21 m2 with four replications and date of sowing was 15th November, 2021. However for stress condition, each genotype was sown on 23rd November, 2021 on a plot size of 6.9 m2 with three replications under natural soil salinity patch having sandy loam texture with pH 8.3 and Ec 4 dsm-1. The package of practices recommended for both environments were accordingly followed to raise the crop.
The traits viz., days to heading, days to maturity, plant height (cm), number of effective tillers per meter, spike length (cm), number of grains per spike, 1000-grain weight (g), biological yield (q/ha), harvest index (%), and grain yield (q/ha) were studied under both stress and non-stressed environments. The biological and grain yield were recorded on plot basis and converted in quintals per hectare (q/ha). The different stress indices used in the present study for salt tolerance are given in Table 1. The recorded data was subjected to statistical analysis using Microsoft Excel for calculation of stress indices. R studio version 2023.12.1.402 was used for correlation coefficient and cluster analysis. SPSS Statistics version 27 was exploited for Principal Component Analysis (PCA) and to draw the biplot diagram.
Table 1: Stress indices used in the study
|
Sr. No. |
Stress indices |
Abbreviations |
References |
|
1 |
Stress susceptibility index |
SSI |
Fischer and Maurer (1978)23 |
|
2 |
Stress tolerance |
TOL |
Rosielle and Hamblin (1981)24 |
|
3 |
Stress tolerance index |
STI |
Fernandez (1992)25 |
|
4 |
Stress susceptibility percentage index |
SSPI |
Moosavi et al. (2008)26 |
|
5 |
Yield index |
YI |
Gavuzzi et al. (1997)27 |
|
6 |
Yield susceptibility index |
YSI |
Bouslama and Schapaugh (1984)28 |
|
7 |
Relative stress index |
RSI |
Fischer and Wood (1979)29 |
|
8 |
Mean productivity |
MP |
Rosielle and Hamblin (1981)24 |
|
9 |
Geometric mean productivity |
GMP |
Fernandez (1992)25 |
|
10 |
Harmonic mean |
HM |
Bidinger et al. (1987)30 |
|
11 |
Mean relative performance |
MRP |
Ramirez and Kelly (1998)31 |
|
12 |
Reduction |
RED |
Farshadfar and Javadinia (2011)32 |
Results and Discussion
The performance of genotypes for different traits is presented in Table 2. The results revealed differences in the performance of genotypes under both conditions. The genotypes BH 20-38, BH 19-44 and BH 19-52 were found with maximum grain yield and high harvest index under normal condition. Similarly the genotypes viz., BH 946 and BH 20-40 exhibited highest biological yield. Among the genotypes, BH 19-02 and DWRB 91 were found early maturing. BH 20-09 was recorded with minimum plant height along with highest number of effective tillers per meter. The genotype BH 20-36 among two rowed and BH 19-44 among six rowed showed longest spike length with highest number of grains per spike. Likewise, BH 20-02 and BH 20-36 revealed highest 1000-grain weight under normal environment. Under salinity condition, BH 19-15 and BH 946 gave highest grain as well as biological yield. Highest harvest index and 1000-grain weight were recorded for BH 20-02 and BH 19-02. Highest number of effective tillers were found in BH 19-13 followed by DWRB 91. Similarly, genotype BH 20-38 among two rowed and BH 19-44 among six rowed showed longest spikes and high number of grains per spike.
Table 2: Performance of barley genotypes for different traits under non-stress and stress conditions.
|
Sr. |
Geno |
RT |
E |
DH |
DM |
PH |
ETM |
SL |
GPS |
TGW |
BY |
HI |
GY |
|
1 |
BH |
6 |
NS |
87 |
135 |
114 |
115 |
7.7 |
62 |
40.1 |
126.01 |
32.82 |
41.36 |
|
S |
82 |
123 |
105 |
90 |
6.1 |
54 |
33.1 |
111.59 |
25.16 |
28.07 |
|||
|
2 |
BH |
6 |
NS |
90 |
133 |
118 |
174 |
6.8 |
60 |
37.2 |
124.40 |
34.15 |
42.48 |
|
S |
85 |
126 |
113 |
87 |
6.5 |
58 |
29.9 |
90.34 |
22.89 |
20.68 |
|||
|
3 |
BH |
6 |
NS |
90 |
137 |
114 |
172 |
7.4 |
64 |
34.4 |
130.84 |
28.06 |
36.71 |
|
S |
84 |
126 |
108 |
108 |
7.0 |
60 |
31.8 |
91.30 |
25.24 |
23.04 |
|||
|
4 |
BH |
2 |
NS |
90 |
134 |
105 |
155 |
8.1 |
27 |
39.7 |
134.46 |
34.64 |
46.58 |
|
S |
82 |
124 |
91 |
88 |
7.1 |
25 |
34.7 |
84.06 |
23.97 |
20.14 |
|||
|
5 |
BH |
2 |
NS |
90 |
132 |
102 |
178 |
6.3 |
27 |
43.4 |
119.56 |
31.52 |
37.68 |
|
S |
83 |
121 |
95 |
96 |
5.2 |
24 |
40.1 |
69.57 |
29.03 |
20.19 |
|||
|
6 |
BH |
6 |
NS |
88 |
135 |
116 |
93 |
7.5 |
71 |
40.7 |
136.88 |
26.56 |
36.35 |
|
S |
80 |
127 |
86 |
72 |
6.0 |
58 |
30.2 |
54.59 |
24.07 |
13.14 |
|||
|
7 |
BH |
2 |
NS |
91 |
138 |
91 |
194 |
7.2 |
27 |
45.9 |
133.65 |
28.13 |
37.60 |
|
S |
81 |
128 |
81 |
122 |
6.0 |
26 |
38.2 |
78.26 |
19.69 |
15.41 |
|||
|
8 |
BH |
6 |
NS |
90 |
134 |
119 |
130 |
8.3 |
76 |
39.8 |
125.60 |
33.86 |
42.53 |
|
S |
78 |
127 |
107 |
94 |
7.0 |
62 |
33.5 |
90.34 |
22.89 |
20.68 |
|||
|
9 |
BH |
6 |
NS |
89 |
136 |
102 |
154 |
6.3 |
58 |
34.3 |
127.17 |
31.71 |
40.33 |
|
S |
84 |
127 |
96 |
134 |
6.0 |
44 |
29.9 |
75.85 |
18.79 |
14.25 |
|||
|
10 |
DWRB |
2 |
NS |
90 |
132 |
95 |
148 |
8.0 |
28 |
44.1 |
124.32 |
26.60 |
33.07 |
|
S |
81 |
120 |
90 |
130 |
7.0 |
24 |
38.2 |
55.56 |
24.78 |
13.77 |
|||
|
11 |
BH |
6 |
NS |
90 |
133 |
116 |
119 |
7.3 |
68 |
39.7 |
146.94 |
27.43 |
40.31 |
|
S |
86 |
125 |
103 |
83 |
6.5 |
62 |
32.2 |
106.28 |
25.05 |
26.62 |
|||
|
12 |
BH |
2 |
NS |
96 |
137 |
101 |
155 |
8.2 |
28 |
49.2 |
130.67 |
28.13 |
36.76 |
|
S |
91 |
125 |
99 |
96 |
7.0 |
24 |
44.8 |
77.29 |
25.69 |
19.86 |
|||
|
13 |
RD |
6 |
NS |
91 |
133 |
112 |
114 |
7.1 |
62 |
33.5 |
125.33 |
25.88 |
32.44 |
|
S |
85 |
127 |
100 |
96 |
6.5 |
60 |
31.0 |
74.88 |
24.06 |
18.02 |
|||
|
14 |
BH |
2 |
NS |
91 |
134 |
98 |
106 |
8.2 |
29 |
48.7 |
122.79 |
26.18 |
32.14 |
|
S |
81 |
126 |
90 |
112 |
7.1 |
24 |
38.2 |
83.09 |
24.01 |
19.95 |
|||
|
|
Mean |
NS |
90.2 |
134.5 |
107.4 |
143.3 |
7.5 |
49.0 |
40.8 |
129.2 |
29.7 |
38.3 |
|
|
S |
83.1 |
125.1 |
97.4 |
100.6 |
6.5 |
43.2 |
34.7 |
81.6 |
24.0 |
19.6 |
|||
|
Max. |
NS |
96 |
138 |
119 |
194 |
8.3 |
76 |
49.2 |
146.94 |
34.64 |
46.58 |
||
|
S |
91 |
128 |
113 |
134 |
7.1 |
62 |
44.8 |
111.59 |
29.03 |
28.07 |
|||
|
Min. |
NS |
87 |
132 |
91 |
93 |
6.3 |
27 |
33.5 |
119.56 |
25.88 |
32.14 |
||
|
S |
78 |
120 |
81 |
72 |
5.2 |
24 |
29.9 |
54.59 |
18.79 |
13.14 |
|||
RT: Row type, E: Environment/condition, NS: Non-stress, S: Stress, DH: Days to heading, DM: Days to maturity, PH: Plant height, ETM: Number of effective tillers per meter, SL: Spike length, GPS: Number of grains per spike, TGW: 1000-grain weight, BY: Biological yield, HI: Harvest index, GY: Grain yield
In order to examine the salt tolerance of genotypes exploiting all the studied traits, SSI was calculated and presented in Table 3.The grain yield recorded under non-stress and stress conditions are indicated as Yp and Ys, respectively. The genotypes BH 20-38 and BH 19-15 were found with maximum (46.58 and 28.07 q/ha) while, BH 20-36 and BH 20-40 were recorded with minimum (32.14 and 13.14 q/ha) grain yield under normal and stress conditions, respectively. The results also displayed the reduction in mean grain yield by 48.94 percent under stress condition as compared with non-stress indicating the severe impact of salinity on grain yield of genotypes. Significant decrease in the growth of barley plant due to salinity stress was also cited by Pour-Aboughadareh et al. (2021)33. Higher SSI values represent the susceptibility of genotypes to salinity and vice versa23. Based on SSI values of traits, the genotypes were ranked and the genotypes, RD 2794, BH 19-49, BH 946 and BH 19-52 were found salt tolerant among fourteen genotypes screened. Though these genotypes exhibited salt tolerance but RD 2794 being a check variety showed low yield potential, hence grain yield should be considered while selecting promising genotypes.
Table 3: Grain yield and stress susceptibility index (SSI) of barley genotypes for different traits
|
Sr. |
Geno |
Yp |
Ys |
DH |
DM |
PH |
ETM |
SL |
GPS |
TGW |
BY |
HI |
GY |
R |
|
1 |
BH |
41.36 |
28.07 |
0.73 |
1.28 |
0.88 |
0.72 |
1.62 |
1.09 |
1.17 |
0.31 |
1.21 |
0.66 |
14 |
|
2 |
BH |
42.48 |
20.68 |
0.11 |
0.11 |
0.09 |
1.02 |
0.08 |
0.07 |
0.40 |
0.56 |
0.67 |
1.05 |
4 |
|
3 |
BH |
36.71 |
23.04 |
0.14 |
0.16 |
0.11 |
0.76 |
0.11 |
0.12 |
0.15 |
0.62 |
0.21 |
0.76 |
2 |
|
4 |
BH |
46.58 |
20.14 |
0.18 |
0.15 |
0.27 |
0.88 |
0.26 |
0.17 |
0.26 |
0.77 |
0.63 |
1.16 |
11 |
|
5 |
BH |
37.68 |
20.19 |
0.16 |
0.17 |
0.14 |
0.94 |
0.36 |
0.23 |
0.16 |
0.86 |
0.16 |
0.95 |
9 |
|
6 |
BH |
36.35 |
13.14 |
0.19 |
0.12 |
0.53 |
0.46 |
0.42 |
0.39 |
0.53 |
1.23 |
0.19 |
1.31 |
13 |
|
7 |
BH |
37.60 |
15.41 |
0.22 |
0.15 |
0.22 |
0.76 |
0.34 |
0.03 |
0.34 |
0.85 |
0.61 |
1.21 |
12 |
|
8 |
BH |
42.53 |
20.68 |
0.27 |
0.11 |
0.21 |
0.57 |
0.32 |
0.37 |
0.32 |
0.57 |
0.66 |
1.05 |
10 |
|
9 |
BH |
40.33 |
14.25 |
0.11 |
0.14 |
0.13 |
0.27 |
0.10 |
0.49 |
0.26 |
0.83 |
0.83 |
1.32 |
8 |
|
10 |
DWRB |
33.07 |
13.77 |
0.20 |
0.19 |
0.11 |
0.25 |
0.26 |
0.29 |
0.27 |
1.13 |
0.14 |
1.19 |
7 |
|
11 |
BH |
40.31 |
26.62 |
0.09 |
0.12 |
0.23 |
0.62 |
0.22 |
0.18 |
0.39 |
0.57 |
0.18 |
0.69 |
3 |
|
12 |
BH |
36.76 |
19.86 |
0.11 |
0.18 |
0.03 |
0.77 |
0.30 |
0.29 |
0.18 |
0.84 |
0.18 |
0.94 |
5 |
|
13 |
RD |
32.44 |
18.02 |
0.13 |
0.09 |
0.22 |
0.32 |
0.17 |
0.07 |
0.15 |
0.82 |
0.14 |
0.91 |
1 |
|
14 |
BH |
32.14 |
19.95 |
0.22 |
0.12 |
0.16 |
-0.12 |
0.27 |
0.33 |
0.44 |
0.66 |
0.17 |
0.78 |
5 |
|
|
Mean |
38.31 |
19.56 |
0.21 |
0.22 |
0.24 |
0.59 |
0.34 |
0.29 |
0.36 |
0.76 |
0.43 |
1.00 |
|
|
|
Max. |
46.58 |
28.07 |
0.73 |
1.28 |
0.88 |
1.02 |
1.62 |
1.09 |
1.17 |
1.23 |
1.21 |
1.32 |
|
|
|
Min. |
32.14 |
13.14 |
0.09 |
0.09 |
0.03 |
-0.12 |
0.08 |
0.03 |
0.15 |
0.31 |
0.14 |
0.66 |
Yp: Grain yield (q/ha) under non-stress condition, Ys: Grain yield (q/ha) under stress condition, DH: Days to heading, DM: Days to maturity, PH: Plant height, ETM: Number of effective tillers per meter, SL: Spike length, GPS: Number of grains per spike, TGW: 1000-grain weight, BY: Biological yield, HI: Harvest index, R: Overall rank
The efficient salt screening techniques in barley are still lacking. Hence, a set of twelve stress indices calculated using grain yield were employed in order to select the tolerant genotypes. Among the stress indices exploited, the higher estimates of SSI, TOL, SSPI, RSI, and RED reflected susceptibility of genotypes to salt, however, higher STI, YI, YSI, MP, GMP, HM and MRP estimates indicated salt tolerance. All the genotypes were further ranked considering all the indices simultaneously, indicated as overall rank (Table 4). The most promising genotypes tolerant to salinity thus identified included BH 19-15, BH 946, BH 19-49, BH 20-36 and BH 19-52 among the entries evaluated. Mariey et al. (2022)34 in a study illustrated MP, HM and STI as more effective indices for detection of high yielding genotypes. Various researchers also applied different stress indices in barley for sorting the salt tolerant genotypes4, 16, 35.
Table 4: Stress indices of barley genotypes
|
Sr. No. |
Geno |
SSI |
TOL |
STI |
SSPI |
YI |
YSI |
RSI |
MP |
GMP |
HM |
MRP |
RED |
R |
|
1 |
BH |
0.66 |
13.29 |
0.79 |
17.34 |
1.44 |
0.68 |
2.89 |
34.72 |
34.08 |
33.45 |
1.33 |
0.32 |
1 |
|
2 |
BH |
1.05 |
21.81 |
0.60 |
28.46 |
1.06 |
0.49 |
4.02 |
31.58 |
29.64 |
27.82 |
0.95 |
0.51 |
5 |
|
3 |
BH |
0.76 |
13.67 |
0.58 |
17.84 |
1.18 |
0.63 |
3.12 |
29.88 |
29.09 |
28.32 |
1.23 |
0.37 |
3 |
|
4 |
BH |
1.16 |
26.44 |
0.64 |
34.50 |
1.03 |
0.43 |
4.53 |
33.36 |
30.63 |
28.13 |
0.85 |
0.57 |
10 |
|
5 |
BH |
0.95 |
17.49 |
0.52 |
22.82 |
1.03 |
0.54 |
3.66 |
28.94 |
27.58 |
26.30 |
1.05 |
0.46 |
5 |
|
6 |
BH |
1.31 |
23.21 |
0.33 |
30.29 |
0.67 |
0.36 |
5.42 |
24.75 |
21.86 |
19.30 |
0.71 |
0.64 |
14 |
|
7 |
BH |
1.21 |
22.19 |
0.39 |
28.96 |
0.79 |
0.41 |
4.78 |
26.51 |
24.07 |
21.86 |
0.80 |
0.59 |
11 |
|
8 |
BH |
1.05 |
21.86 |
0.60 |
28.52 |
1.06 |
0.49 |
4.03 |
31.60 |
29.65 |
27.83 |
0.95 |
0.51 |
8 |
|
9 |
BH |
1.32 |
26.08 |
0.39 |
34.04 |
0.73 |
0.35 |
5.54 |
27.29 |
23.97 |
21.06 |
0.69 |
0.65 |
13 |
|
10 |
DWRB |
1.19 |
19.30 |
0.31 |
25.19 |
0.70 |
0.42 |
4.70 |
23.42 |
21.34 |
19.44 |
0.82 |
0.58 |
12 |
|
11 |
BH |
0.69 |
13.69 |
0.73 |
17.87 |
1.36 |
0.66 |
2.97 |
33.46 |
32.76 |
32.06 |
1.29 |
0.34 |
2 |
|
12 |
BH |
0.94 |
16.90 |
0.50 |
22.06 |
1.02 |
0.54 |
3.63 |
28.31 |
27.02 |
25.78 |
1.06 |
0.46 |
5 |
|
13 |
RD |
0.91 |
14.42 |
0.40 |
18.82 |
0.92 |
0.56 |
3.53 |
25.23 |
24.18 |
23.17 |
1.09 |
0.44 |
9 |
|
14 |
BH |
0.78 |
12.19 |
0.44 |
15.91 |
1.02 |
0.62 |
3.16 |
26.05 |
25.32 |
24.62 |
1.22 |
0.38 |
4 |
|
Mean |
1.00 |
18.75 |
0.51 |
24.47 |
1.00 |
0.51 |
4.00 |
28.93 |
27.23 |
25.65 |
1.00 |
0.49 |
||
|
Max. |
1.32 |
26.44 |
0.79 |
34.50 |
1.44 |
0.68 |
5.54 |
34.72 |
34.08 |
33.45 |
1.33 |
0.65 |
||
|
Min. |
0.66 |
12.19 |
0.31 |
15.91 |
0.67 |
0.35 |
2.89 |
23.42 |
21.34 |
19.30 |
0.69 |
0.32 |
SSI: Stress susceptibility index, TOL: Stress tolerance, STI: Stress tolerance index, SSPI: Stress susceptibility percentage index, YI: Yield index, YSI: Yield stability index, RSI: Relative stress index, MP: Mean productivity, GMP: Geometric mean productivity, HM: Harmonic mean, MRP: Mean relative performance, RED: Reduction, R: Overall rank
Further, correlation coefficient analysis was performed among stress indices including grain yield (Yp and Ys) and findings are illustrated in Table 5. Grain yield (Ys) showed negative association with SSI, TOL, SSPI, RSI and RED and significant positive correlation with the indices viz., STI, YI, YSI, MP, GMP, HM and MRP, signifying importance of these indices for salt tolerance under stress. Hence, lower SSI, TOL, SSPI, RSI and RED, and higher STI, YI, YSI, MP, GMP, HM and MRP could be regarded as the best selection indicators for salinity breeding. The negative correlation of SSI with grain yield under stress condition was also substantiated by Bhagat et al. (2023)36. Likewise, among the stress indices, significant positive associations were observed for SSI with TOL, SSPI, RSI and RED; TOL with SSPI, RSI and RED; STI with YI, YSI, MP, HM, GMP and MRP; SSPI with RSI and RED; YI with YSI, MP, HM, GMP and MRP; YSI with HM, GMP and MRP; RSI with RED; and MP and GMP with HM; HM with MRP. The results also revealed significant negative associations of SSI with STI, YI, YSI, HM, GMP and MRP; TOL and SSPI with YI, YSI and MRP; STI with RSI and RED; YI and YSI with RSI and RED; and RSI and RED with MRP, GMP and HM. These results corroborate the association among two or more variables with the findings of Nazari and Pakniyat (2010)37, Taherian et al. (2017)16, Mariey et al. (2019)38, Sally et al. (2019)35 and Ghomi et al. (2023)9.
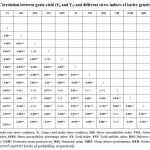 |
Table 5: Correlation between grain yield (Yp and Ys) and different stress indices of barley genotypes |
Principal Component Analysis (PCA) represents the association between all traits at once with reduced number of variables that contribute to the maximum percentage of total variation, is better criterion over correlation coefficient for assorting promising genotypes in different environments39. PCA based on grain yield and stress indices as depicted in Table 6 revealed that the first two components with eigen value > 1.00 accounted for about 99.62 percent of the total variation present in the studied genotypes. The results are in line with observation of Nazari and Pakniyat (2010)37 and Ghomi et al. (2023)9; they explained 97.9 and 99.2 percent of variation by first two PCs, respectively. Javed et al. (2022)5 based on principal component analysis explained 53% of the total variability by first two components and also identified high salt tolerant genotypes. The first PC accounted for 74.25 percent of the total variance, regarded as salt tolerant component as it showed strong association with Ys, STI, YI, YSI, MP, GMP, HM and MRP. Similarly, second PC explained 25.37 percent of the total variability and exhibited strong correlation with SSI, TOL, SSPI, RSI, RED and YP therefore, considered as salt susceptible component. Thus, the selection of genotypes with high PC 1 and low PC 2 are suitable for both environments. Consequently, genotypes BH 19-15, BH 946, BH 19-49, BH 20-36 were found with high PC1 and low PC2 therefore, regarded as superior genotypes for both stress and non-stress conditions. Similar kind of approach was also used by Dorostkar et al. (2015)40 to classify the components.
Table 6: Principal component analysis based on grain yield and stress indices in barley genotypes
|
Components |
PC 1 |
PC 2 |
|
Eigen value |
10.395 |
3.551 |
|
Proportion of total variation (%) |
74.251 |
25.367 |
|
cumulative percentage of variance |
74.251 |
99.618 |
|
Yp |
0.166 |
0.986 |
|
Ys |
0.977 |
0.207 |
|
SSI |
-0.96 |
0.278 |
|
TOL |
-0.75 |
0.659 |
|
STI |
0.846 |
0.53 |
|
SSPI |
-0.75 |
0.658 |
|
YI |
0.977 |
0.21 |
|
YSI |
0.958 |
-0.286 |
|
RSI |
-0.946 |
0.276 |
|
MP |
0.707 |
0.707 |
|
GMP |
0.844 |
0.536 |
|
HM |
0.917 |
0.397 |
|
MRP |
0.957 |
-0.287 |
|
RED |
-0.958 |
0.286 |
In the biplot analysis, when the angle between their vectors is < 90 (acute) degrees indicated the positive association of indices and when the angle is > 90 (obtuse) degrees that showed negative correlation among indices41. First two components were used to construct biplot (Fig. 1) for comparing relationship between genotypes and stress indices. The biplot displayed positive associations of Ys with STI, YI, YSI, MP, GMP, HM and MRP, while negatively correlated with SSI, TOL, SSPI, RSI and RED as indicated by the acute and obtuse angles between their vectors, respectively. Likewise, STI, YI, YSI, MP, GMP, HM and MRP exhibited negative correlation with SSI, TOL, SSPI, RSI and RED and positively associated among themselves.
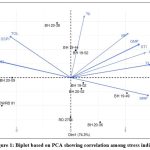 |
Figure 1: Biplot based on PCA showing correlation among stress indices. |
The cluster analysis was also performed based on stress indices that classified all the genotypes into three distinct clusters and the findings are illustrated in Table 7 with genetic distances between clusters. The clustering pattern identified cluster I as largest one with seven genotypes, whereas, cluster II being smallest contained three genotypes. The estimates of various stress indices were also used by Lamba et al. (2023)42 for clustering of genotypes evaluated under stress condition. Several other genetic studies for classification of genotypes into different tolerance categories have also been conducted in barley using stress indices5, 9. The association among the studied genotypes is presented in Fig. 2 in the form of dendrogram displaying the genetic divergence of genotypes. The genetic distances (intra and inter-cluster) were also calculated (Table 7), indicating the magnitude of genetic diversity among the genotypes. The results revealed maximum intra-cluster distance for cluster I, implies the genotypes with relatively more diversity compared to genotypes belonging to other clusters. The results in addition also revealed that cluster I placed most distantly from cluster III as deciphered by maximum inter-cluster distance among all cluster combinations. The cluster analysis of 326 genotypes constituted two distinct classes in relation to stress tolerance in barley, also substantiated by Abou-Elwafa and Amein (2016)43.
Table 7: Clustering of barley genotypes based on stress indices and genetic distances
|
Cluster Members |
Number of Genotypes |
Clusters |
Cluster Distances |
||
|
Cluster I |
Cluster II |
Cluster III |
|||
|
BH 19-15, BH 19-49, BH 19-02, BH 946, BH 20-02, RD 2794, BH 20-36 |
7 |
Cluster I |
21.88 |
29.21 |
31.17 |
|
BH 19-52, BH 20-38, BH 19-44 |
3 |
Cluster II |
29.21 |
8.92 |
24.93 |
|
BH 20-40, BH 20-09, BH 19-13, DWRB 91 |
4 |
Cluster III |
31.17 |
24.93 |
14.23 |
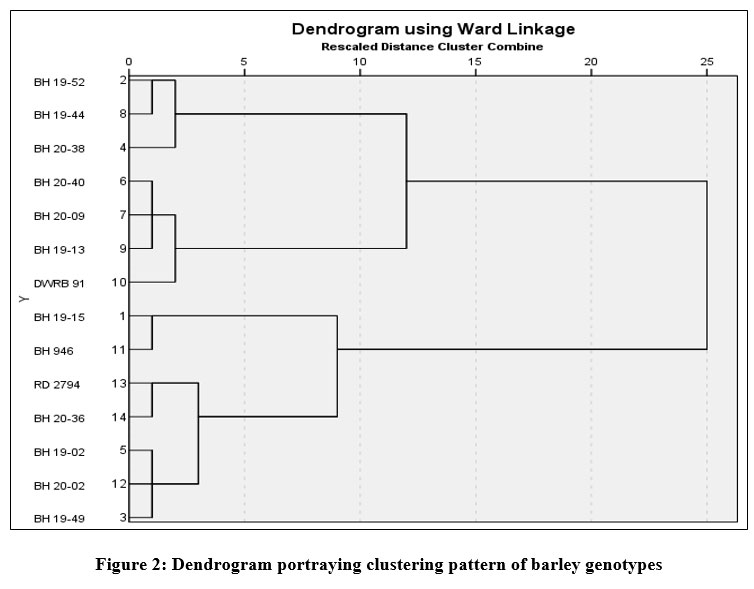 |
Figure 2: Dendrogram portraying clustering pattern of barley genotypes |
The average performance of genotypes in relation to grain yield (Yp and Ys) and stress indices under study is portrayed in Table 8. The observations indicated cluster I with minimum SSI, TOL, SSPI, RSI, and RED, and higher YI, YSI, MRP and Ys. Similarly, cluster II characterized by higher STI, MP, GMP, HM and Yp. Hence, genotypes from cluster I and II be considered as promising for stress and non-stress conditions, respectively. They may be utilized for furtherance of genetic gain in yield and other traits while stepping up barley breeding in stress and normal growing situations.
Table 8: Performance of clusters for grain yield of genotypes and stress indices.
|
|
Yp |
Ys |
SSI |
TOL |
STI |
SSPI |
YI |
YSI |
RSI |
MP |
GMP |
HM |
MRP |
RED |
|
Cluster |
36.77 |
22.25 |
0.81 |
14.52 |
0.56 |
18.95 |
1.14 |
0.60 |
3.28 |
29.51 |
28.57 |
27.67 |
1.18 |
0.40 |
|
Cluster |
43.87 |
20.50 |
1.09 |
23.37 |
0.61 |
30.50 |
1.05 |
0.47 |
4.19 |
32.18 |
29.98 |
27.92 |
0.92 |
0.53 |
|
Cluster |
36.84 |
14.14 |
1.26 |
22.70 |
0.36 |
29.62 |
0.72 |
0.39 |
5.11 |
25.49 |
22.81 |
20.42 |
0.75 |
0.61 |
Conclusion
From current study, it could be concluded that stress indices used were recognized as imperative for identifying cultivars with high tolerance to salinity. Based on average rank of SSI of different traits, the genotypes, RD 2794, BH 19-49, BH 946 and BH 19-52 were found salt tolerant among fourteen genotypes screened. However, results based on overall rank of stress indices employed on grain yield illustrated the genotypes, BH 19-13, BH 20-40, BH 393, BH 19-15, BH 20-02 and BH 946 as elite breeding material for resisting stress conditions. Grain yield (Ys) showed significant negative association with SSI, TOL, SSPI, RSI and RED, and significant positive correlation with the indices viz., STI, YI, YSI, MP, GMP, HM and MRP, signifying importance of these indices for salinity tolerance under stress. The first PC accounted for 74.25 percent of the total variance and regarded as salt tolerant component as it showed strong association with grain yield (Ys) and STI, YI, YSI, MP, GMP, HM, MRP indices under salinity. The genotypes of cluster I indicated minimum SSI, TOL, SSPI, RSI, RED and higher YI, YSI, MRP and Ys, consequently could be utilized as elite donor for salinity tolerance breeding in barley.
Acknowledgement
The author’s expresses sincere gratitude to Head, Department of Genetics and Plant Breeding, College of Agriculture, CCS Haryana Agricultural University, Hisar-125004 for providing research facilities.
Funding Sources
The author(s) received no financial support for the research, authorship, and/or publication of the article
Conflict of Interest
The authors declare that there is no conflict of interest.
Data Availability Statement
This statement does not apply to this article.
Ethics Statement
This research did not involve human participants, animal, subjects, or any material that requires The ethical approval.
Informed Consent Statement
This study did not involve human participants, and therefore, informed consent was not required.
Authors’ Contribution
YK: Execution of field experiment, data recording and compilation, manuscript finalization, DP & HC: Manuscript writing, SD & SC: Statistical analysis. All the listed authors read and approved the manuscript.
References
- Hassan A., Amjad S.F., SaleemH., Yasmin H., Imran M., Riaz M., Ali Q., Joyia F.A., Mobeen, Ahmed S., Ali S., Alsahli A.A., Alyemeni M.N. Foliar application of ascorbic acid enhances salinity stress tolerance in barley (Hordeum vulgare L.) through modulation of morpho-physio-biochemical attributes, ions uptake, osmo-protectants and stress response genes expression. Saudi J Biol Sci. 2021; 28:4276-4290.
CrossRef - Purugganan M.D., Fuller D.Q. The nature of selection during plant domestication. Nature, 2009; 457 (7231):843-848.
CrossRef - Ghorbani S., Etminan A., Rashidi V., Pour-Aboughadareh A., Shooshtari L.Delineation of physiological and transcriptional responses of different barley genotypes to salt stress. Cereal Res Commun. 2023; 51: 367-377.
CrossRef - Jamshidi A., Javanmard H.R. Evaluation of barley (Hordeum vulgare) genotypes for salinity tolerance under field conditions using the stress indices. Ain Shams Engin J. 2018; 9: 2093-2099.
CrossRef - Javed M.M., Al-Doss A.A., Tahir M.U., Khan M.A., El-Hendawy S. Assessing the suitability of selection approaches and genetic diversity analysis for early detection of salt tolerance of barley genotypes. Agron. 2022; 12: 3217.
CrossRef - Subhani G.M., Abdullah, Ahmad J., Anwar J., Hussain M., Mahmood A. Identification of drought tolerant genotypes of barley (Hordeum vulgare) through stress tolerance indices. J Animal Plant Sci. 2015; 25: 686-692.
- Kumar A., Verma R.P.S., Singh A., Sharma H.K., Devi G. Barley landraces: Ecological heritage for edaphic stress adaptations and sustainable production. Environ Sustain Indic 2020; 6:10003.
CrossRef - ICAR-IIWBR. Director’s report of AICRP on Wheat and Barley 2022-23, Ed: Gyanendra Singh. ICAR-Indian Institute of Wheat and Barley Research, Karnal, Haryana, India. 2023; P. 90.
- Ghomi Kh., Rabiei B., Sabouri H., Puralamdari E. G. Evaluation of late season heat in barley genotypes using some susceptibility and tolerance indices. Environ Stresses Crop Sci. 2023; 15 (4): 1091-1108.
- Dawson I.K., Russell J., Powell W., Steffenson B., Thomas W.T., Waugh R. Barley: a translational model for adaptation to climate change. New Phytol. 2015; 206:913-31.
CrossRef - Alkharabsheh H.M., Seleiman M.F., Hewedy O.A., Battaglia M.L., Jalal R.S., Alhammad B.A., Schillaci C., Ali N., Al-Doss, A. Field crop responses and management strategies tomitigate soil salinity in modern agriculture: A review. Agron. 2021; 11: 2299.
CrossRef - Zeeshan M., Lu M., Sehar S., Holford P., Wu F. Comparison of biochemical, anatomical, morphological, and physiological responses to salinity stress in wheat and barley genotypes deferring in salinity tolerance. Agron. 2020; 10: 127.
CrossRef - Butcher K., Wick A.F., De Sutter T., Chatterjee A., Harmon J. Soil salinity: A threat to global food security. Agron J. 2016; 108: 2189-2200.
CrossRef - Safdar H., Amin A., Shafiq Y., Ali A., Yasin R., Shoukat A., Hussan M.U., Sarwar M. I. A review: Impact of salinity on plant growth. Nat Sci. 2019; 17: 34-40.
- Taherian M., Rasoulnia A., Bihamta M.R., Peyghambari A., Alizadeh H. Evaluation of stress tolerance indices in Iranian barley genotypes under salinity and drought conditions. Agric Commun. 2017; 5(3): 7-17.
- Ouertani R. N., Abid G., Chikha M.B., Boudaya O., Mejri S., Karmous C., Ghorbel A. Physiological and biochemical analysis of barley (Hordeum vulgare) genotypes with contrasting salt tolerance. Acta Physiol Plant, 2022; 44:51.
CrossRef - Singh M., Nara U., Kumar A., Choudhary A., Singh H., Thapa S. Salinity tolerance mechanisms and their breeding implications. J Genet Engin Biotech. 2021; 19:173.
CrossRef
- Gurel F., Ozturk Z.N., Ucarli C., Rosellini D. Barley genes as tools to confer abiotic stress tolerance in crops. Front Plant Sci. 2016; 7:1137.
CrossRef - El-Hamamsy S.M.A., Behairy R.T. Effect of salinity stress on seedling vigor and biochemical characters of Egyptian barley landraces (Hordeum vulgare). Middle East J Appl. Sci. 2015; 5: 786-796.
- Ebrahim F., Arzani A., Rahimmalek M., Sun D., Peng J. Salinity tolerance of wild barley Hordeum vulgare spontaneum. Plant Breed. 2020; 139: 304-316.
CrossRef - Munns R., James R. A., Lauchli A. Approaches to increasing the salt tolerance of wheat and other cereals. J Exp Bot. 2006; 57 (5):1025-1043.
CrossRef - Ceron-Rojas J.J., Crossa J. Linear Selection Indices in Modern Plant Breeding. Springer, Cham, Switzerland, 2018; 10.1007/978-3-319-91223-3.
CrossRef - Fischer R., Maurer R. Drought resistance in spring wheat cultivars. I. Grain yield responses. Aust J Agric Res. 1978; 29: 897-912.
CrossRef - Rosielle A.A., Hamblin J. Theoretical aspects of selection for yield in stress and non-stress environments. Crop Sci. 1981; 21: 943-946.
CrossRef - Fernandez G.C.J. Effective selection criteria for assessing plant stress tolerance. In: Proceeding of the International Symposium on Adaptation of Food Crop to Temperature and Water Stress. Publication, Taiwan, 1992: 257-270.
- Moosavi S.S, Samadi Y.B., Naghavi M.R., Zali A.A., Dashti H., Pourshahbazi A. Introduction of new indices to identify relative drought tolerance and resistance in wheat genotypes. Desert, 2008; 12: 165-178.
- Gavuzzi P., Rizza F., Palumbo M., Campaline R.G., Ricciardi G.L., Borghi B. Evaluation of field and laboratory predictors of drought and heat tolerance in winter cereals. Can J Plant Sci. 1997; 77(4): 523-531.
CrossRef - Bouslama M., Schapaugh W.T. Stress tolerance in soybeans. I. Evaluation of three screening techniques for heat and drought tolerance. Crop Sci. 1984; 24(5): 933-937.
CrossRef - Fischer R.A., Wood J.T. Drought resistance in spring wheat cultivars III. Yield association with morpho-physiological traits. Crop Pasture Sci. 1979; 30: 1001-1020.
CrossRef - Bidinger F.R., Mahalakshmi V., Rao G.D.P. Assessment of drought resistance in pearl millet (Pennisetum americanum (L) Leeke). I. Factors affecting yields under stress. Aust J Agric Res. 1987; 38(1): 37-48.
CrossRef - Ramirez P., Kelly J.D. Traits related to drought resistance in common bean. Euphytica, 1998; 99(2): 127-136.
CrossRef - Farshadfar E., Javadinia J. Evaluation of chickpea (Cicer arietinum) genotypes for drought tolerance. Seed and Plant Improv J. 2011; 27(4):517-537.
- Pour-Aboughadareh A., Sanjani S., Chaman-Abad H., Mehrvar M. Asadi A., Amini A. Identification of salt-tolerant barley genotypes using multiple-traits index and yield performance at the early growth and maturity stages. Bull Natl Res Cent. 2021; 45:117.
CrossRef - Mariey S. A., Ghareeb Z. E., Shahein A. M. E. A., Meleha A. M. I., Gomaa H. A., Rady A. M. S., Khatab I. A. Genetic diversity analysis among some barley genotypes using multivariable and molecular markers under different levels of soil salinity stress. Asian J Plant Soil Sci.2022; 7(1): 219-236.
CrossRef - Sally E., Ashgan M., El-Shimaa E. I. Assessment of salinity stress tolerance in some barley genotypes. Alex J Agric Sci.2019; 64(3): 195-206.
CrossRef - Bhagat M.A., Kaur N., Kaur S. Effect of sowing dates on the phenology, grain yield and stress tolerance indices of barley (Hordeum vulgare ) genotypes under subtropical conditions of Punjab. J Agromet. 2023; 25 (1): 113-119.
CrossRef - Nazari L., Pakniyat H. Assessment of drought tolerance in barley genotypes. J Appl Sci. 2010; 10(2): 151-156.
CrossRef - Mariey S.A., Ahmed K.R., Agwa A.M.E., Farid M. A., Serag A.M. Biochemical and molecular genetic markers associated with salt stress tolerance in Egyptian barley cultivars. Egypt J Plant Breed. 2019; 23(3):183-197.
- Nouri A., Etminan A., Teixeira da Silva J. A., Mohammadi R. Assessment of yield, yield related traits and drought tolerance of durum wheat genotypes (Triticum turjidum durum Desf.). Aust J Crop Sci. 2011; 5:8.
- Dorostkar S., Dadkhodaie A., Heidari B. Evaluation of grain yield indices in hexaploid wheat genotypes in response to drought stress. Archives Agron Soil Sci. 2015; 61: 397-413.
CrossRef - Devi K., Chahal S., Singh S., Venkatesh K., Mamrutha H. M., Raghav N., Singh G., Singh G.P., Tiwari R. Assessment of wheat genotypes based on various indices under different heat stress conditions. Indian J Genet. 2021; 81(3): 376-382.
- Lamba K., Kumar M., Singh V., Chaudhary L., Sharma R., Yashveer S., Dalal M.S. Heat stress tolerance indices for identification of the heat tolerant wheat genotypes. Scientific Rep. 2023; 13(1):10842.
CrossRef - Abou-Elwafa S.F., Amein K.A. Genetic diversity and potential high temperature tolerance in barley (Hordeum vulgare). World J Agric Res. 2016; 4 (1):1-8.